Model Performance Expectations: Cross-Validation
March 18, 2026
Reminders from Last Time
Reminders from Last Time
Reminders from Last time
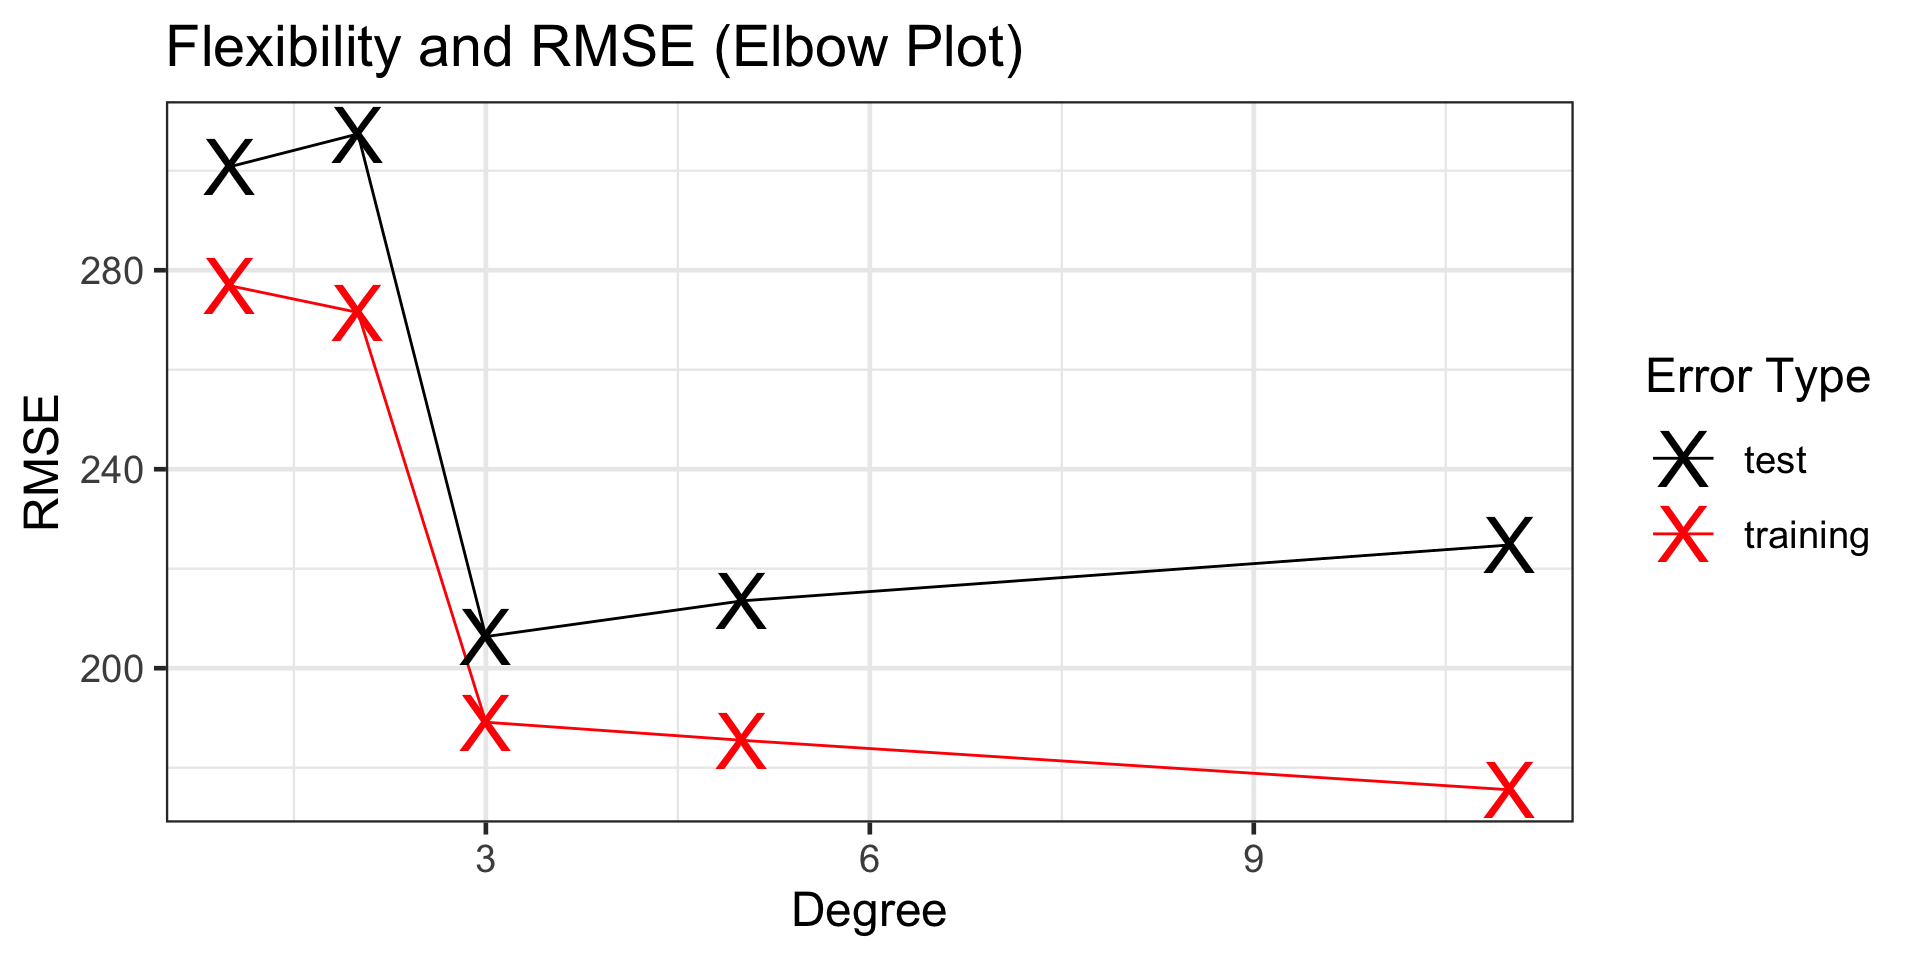
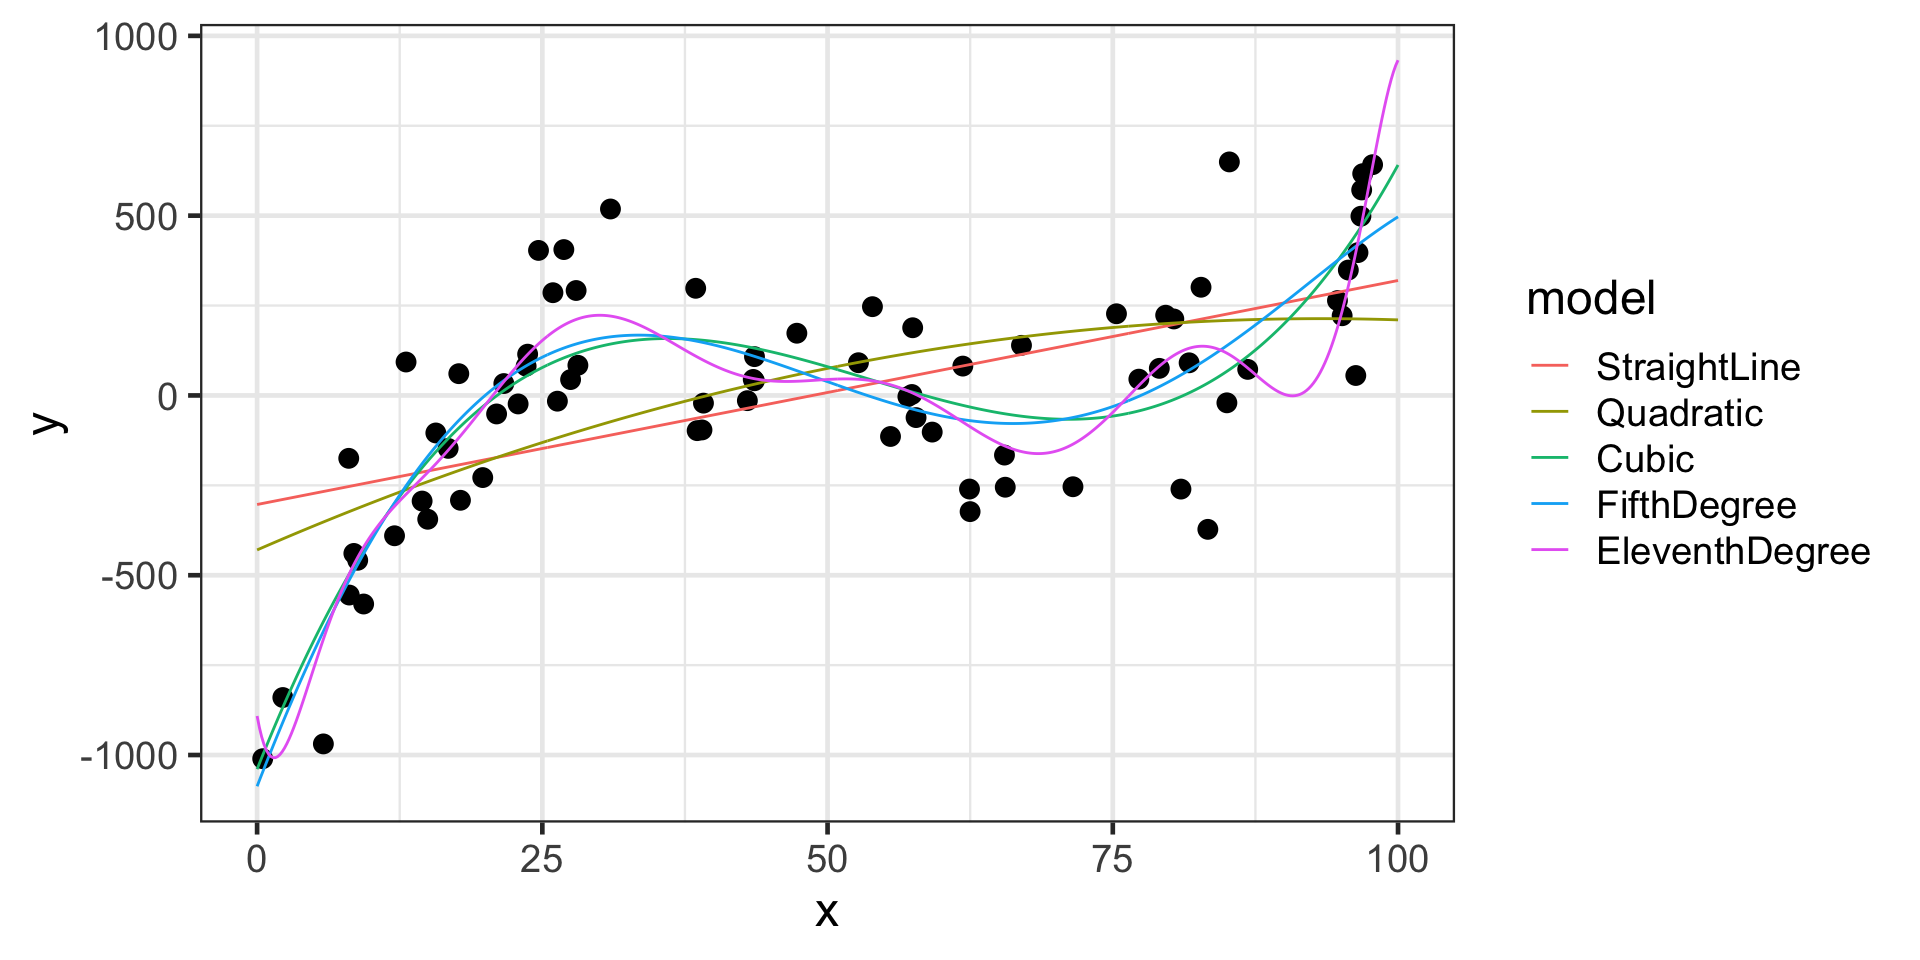
The appropriate level of flexibility is third-degree, since this is where test error “bottoms out”
Reminders from Last Time
| model | degree | training_rsq | training_rmse | test_rsq | test_rmse |
|---|---|---|---|---|---|
| cubic | 3 | 0.6796513 | 189.1408 | 0.5509124 | 206.3521 |
| 5th-Order | 5 | 0.6918323 | 185.5100 | 0.5179021 | 213.5337 |
| 11th-order | 11 | 0.7240143 | 175.5566 | 0.4412691 | 224.7953 |
| straight-line | 1 | 0.3134716 | 276.8874 | 0.0789754 | 300.8079 |
| quadratic | 2 | 0.3398392 | 271.5181 | 0.0738314 | 307.3919 |
We see that the test RMSE for our third degree model is 206.35, so we expect our model’s typical prediction error to be on the order of 206.35
Motivation
Everything seems great!
- We’ve got a method for solving the bias / variance trade-off problem which will identify a best model from a collection of models of varying flexibility for us
- We can use that best model’s test error to approximate expectations for how well the model will perform in the future
…except…
Motivation
With a New Training Set:
| model | degree | training_rsq | training_rmse | test_rsq | test_rmse |
|---|---|---|---|---|---|
| cubic | 3 | 0.6188407 | 182.3788 | 0.3316953 | 238.4026 |
| 11th-order | 11 | 0.6478830 | 175.2930 | 0.3250750 | 244.1142 |
| straight-line | 1 | 0.3313182 | 241.5632 | 0.2193159 | 245.5540 |
| 5th-Order | 5 | 0.6359577 | 178.2366 | 0.3287030 | 245.6532 |
| quadratic | 2 | 0.3381984 | 240.3173 | 0.2168669 | 245.8434 |
And Another One:
| model | degree | training_rsq | training_rmse | test_rsq | test_rmse |
|---|---|---|---|---|---|
| 11th-order | 11 | 0.5722823 | 198.3132 | 0.6499163 | 176.4045 |
| cubic | 3 | 0.5271259 | 208.5190 | 0.5541209 | 188.5136 |
| 5th-Order | 5 | 0.5335218 | 207.1041 | 0.5289463 | 190.6142 |
| straight-line | 1 | 0.1961886 | 271.8629 | 0.4064021 | 210.8317 |
| quadratic | 2 | 0.2816795 | 256.9994 | 0.1585379 | 255.0622 |
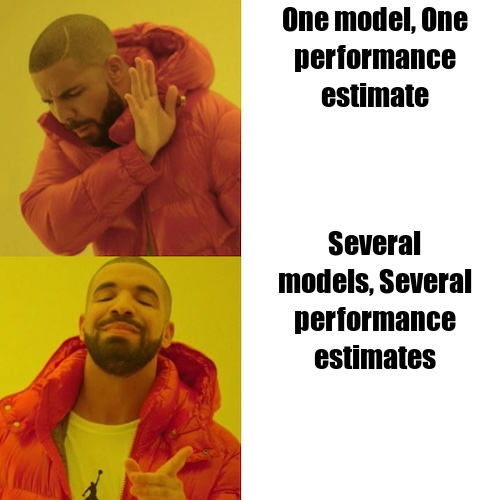
Our Method is Unstable!
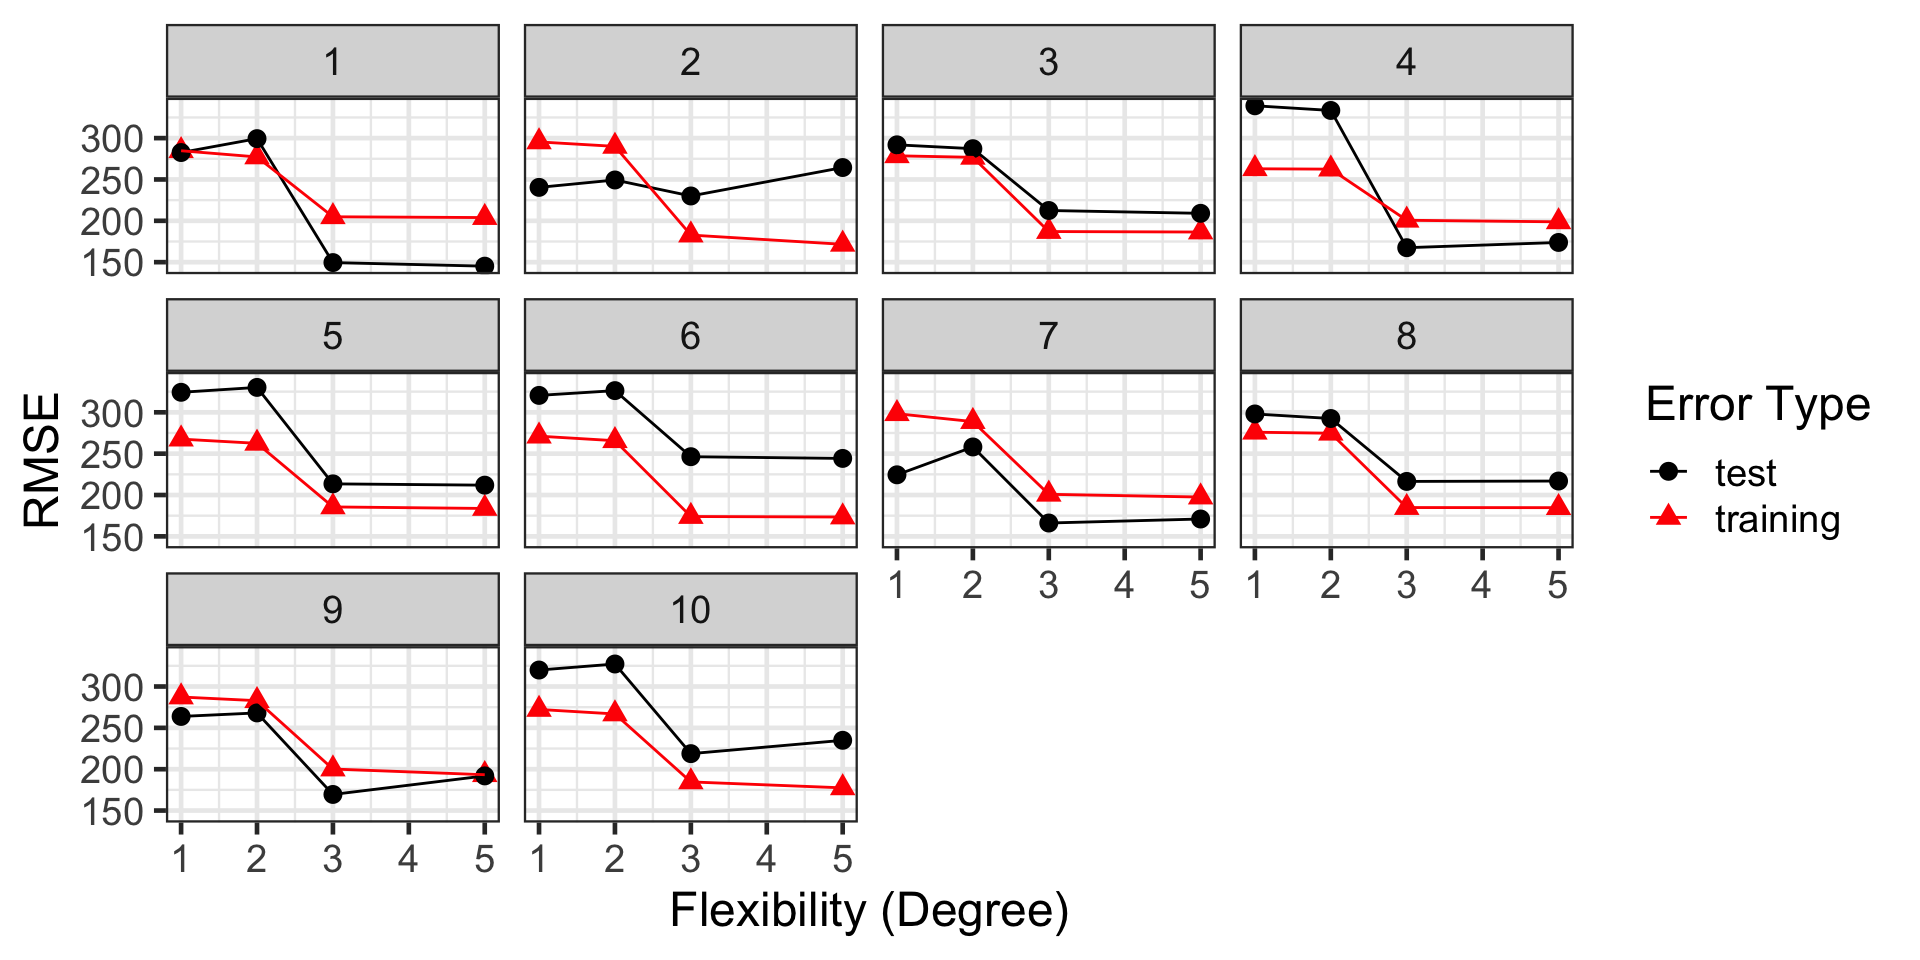
We fairly reliably identify the appropriate level of flexibility
Our Method is Unstable!
| flexibility | trial | type | rsq | rmse |
|---|---|---|---|---|
| 3 | 1 | test | 0.7452874 | 149.4978 |
| 3 | 2 | test | 0.3951219 | 230.0432 |
| 3 | 3 | test | 0.5683425 | 212.4789 |
| 3 | 4 | test | 0.8285252 | 167.4943 |
| 3 | 5 | test | 0.6050025 | 213.4999 |
| 3 | 6 | test | 0.4591706 | 246.3405 |
| 3 | 7 | test | 0.6534396 | 166.1391 |
| 3 | 8 | test | 0.5846136 | 216.4419 |
| 3 | 9 | test | 0.6994682 | 169.4707 |
| 3 | 10 | test | 0.2591332 | 218.8259 |
…but those performance estimates are wild!
Depending on the test set, we could be claiming that our model’s typical prediction error is on the order of \(149.5\) or \(246.3\) – that’s a big difference
Okay, So What’s Going On
We thought we were doing the right thing with our training/test/validation set approach all along, but
this approach left us very vulnerable to the observations which, by chance, fell into our training and validation/test sets
Different training data can lead to different models (beyond even just differences in estimated coefficients) and result in quite different performance expectations
We need a framework that leaves us less susceptible to random chance
Cross-Validation
Randomly split available data into training and test sets
Randomly split the training set into \(k\) folds
For each individual fold…
- Keep that fold as a hold-out set
- Train your model on all remaining folds
- Assess the resulting model on the hold-out
- Store the resulting performance metric
- Forget the learned coefficients
Average your \(k\) performance estimates together
The resulting estimate is our cross-validation performance estimate, which is much more stable than a performance estimate from a single model on a single hold-out set
About Cross-Validation
The following observations are worth calling out
Even when you are using cross-validation, you should initially split your data into a training and final testing set
- That testing set will remain hidden and untouched as a final check before you send a model into “production”
- You’ll no longer need separate testing and validation sets though
Common choices for \(k\) in \(k\)-fold cross-validation are \(k = 5\) and \(k = 10\)
A special case of \(k\)-fold cross-validation sets \(k = n\) so that each observation sits in its own fold – this is referred to as leave one out cross-validation (LOOCV)
Since we are training and assessing multiple models, cross-validation is a more computationally intensive approach than we’ve taken thus far
- More folds means more model fits and assessments, so more compute time
Cross-validation results in performance estimates, but does not result in a fitted model!
- For each fold, before fitting our model, the model fitted prior is obliterated
- Important Restatement: Cross-validation assesses models; it does not fit them
Implementing Cross-Validation in {tidymodels}
Largely, things will remain the same – we’ll start with a model specification, then declare a recipe, and package the model and recipe together into a workflow
There will be three main differences though
After we split our data into training and test sets, we’ll split our training set into folds using the
vfold_cv()functionRather than using the
fit()function to fit our model to the training data, we’ll usefit_resamples()to fit and assess along each fold (resample)The result of
fit_resamples()will be a set of performance metrics calculated on each fold – we’ll obtain these using thecollect_metrics()function
Let’s see this in action with our familiar penguins data
Implementing Cross-Validation in {tidymodels}
We’ll build a fairly complex model that includes all of the available predictors
It also includes interactions between species and both flipper length and bill length as well as an interaction between bill length and bill depth
penguins_split <- initial_split(penguins, prop = 0.9)
penguins_train <- training(penguins_split)
penguins_test <- testing(penguins_split)

penguins_folds <- vfold_cv(penguins_train, v = 10)

lr_spec <- linear_reg() %>%
  set_engine("lm")

lr_rec <- recipe(body_mass_g ~ ., data = penguins_train) %>%
  step_dummy(species) %>%
  step_dummy(island) %>%
  step_interact(~ starts_with("species"):contains("length")) %>%
  step_interact(~ bill_length_mm:bill_depth_mm)

lr_wf <- workflow() %>%
  add_model(lr_spec) %>%
  add_recipe(lr_rec)

lr_results <- lr_wf %>%
  fit_resamples(penguins_folds)
Implementing Cross-Validation in {tidymodels}
Now that we’ve run cross-validation, it’s time to collect the results!
| .metric | .estimator | mean | n | std_err | .config |
|---|---|---|---|---|---|
| rmse | standard | 287.6428273 | 10 | 12.980473 | pre0_mod0_post0 |
| rsq | standard | 0.8622995 | 10 | 0.021012 | pre0_mod0_post0 |
We see that the cross-validation RMSE is about 287.64, with a standard error of about 12.98, so we can be about 95% confident typical body mass prediction error will be on an order somewhere between 287.64 \(\pm 2\cdot\left(\right.\) 12.98\(\left.\right)\)g, or equivalently, somewhere between 261.68g and 313.6g.
Implementing Cross-Validation in {tidymodels}
We can also see the results on each fold – I’ll do a bit of extra manipulation (not shown here) so that we can see both RMSE and \(R^2\) metrics side-by-side
| id | rmse | rsq |
|---|---|---|
| Fold01 | 362.4834 | 0.7540292 |
| Fold02 | 274.2758 | 0.8794673 |
| Fold03 | 302.1292 | 0.7981302 |
| Fold04 | 334.4922 | 0.7574754 |
| Fold05 | 242.2274 | 0.9157606 |
| Fold06 | 261.8536 | 0.9053921 |
| Fold07 | 312.0557 | 0.9015039 |
| Fold08 | 296.0174 | 0.8761237 |
| Fold09 | 241.9070 | 0.9119503 |
| Fold10 | 248.9867 | 0.9231618 |
Summary
The training/test/validation set approach leaves us too vulnerable to randomness
- Both our model and performance metrics are extremely sensitive to our training and test/validation data
We split our training data into folds, using each fold once as a hold-out set, training a model on the remaining folds, and assessing the model on the hold-out fold to obtain multiple models and multiple performance assessments
- Since we have multiple model assessments, some may be on “hard” tests while others are on “easy” tests so the average performance is a more reliable metric
- In taking this cross-validation approach, we no longer need separate test and validation sets
- We can include more of our data as part of the training set, which means we get to learn from more data as well
In
{tidymodels}, we- use
vfold_cv()on our training data to create cross-validation folds - use
fit_resamples()on our folds, instead offit()on the training data, to run the cross-validation procedure and obtain performance metrics on each fold - use
collect_metrics()to access the cross-validation performance measures - once you have a best model (lowest cv-RMSE, highest cv-R-squared, etc.), then
fit()that model to your training data as we’ve done in the past.
- use
Let’s Do This!
Let’s try out cross-validation on the AirBnB Europe data that we were using earlier this semester or with the data you are using for our competition assignments.
Next Time…
Cross-Validation Workshop