MAT 142: Book Functions, Transformations, and Landmarks
June 2, 2026
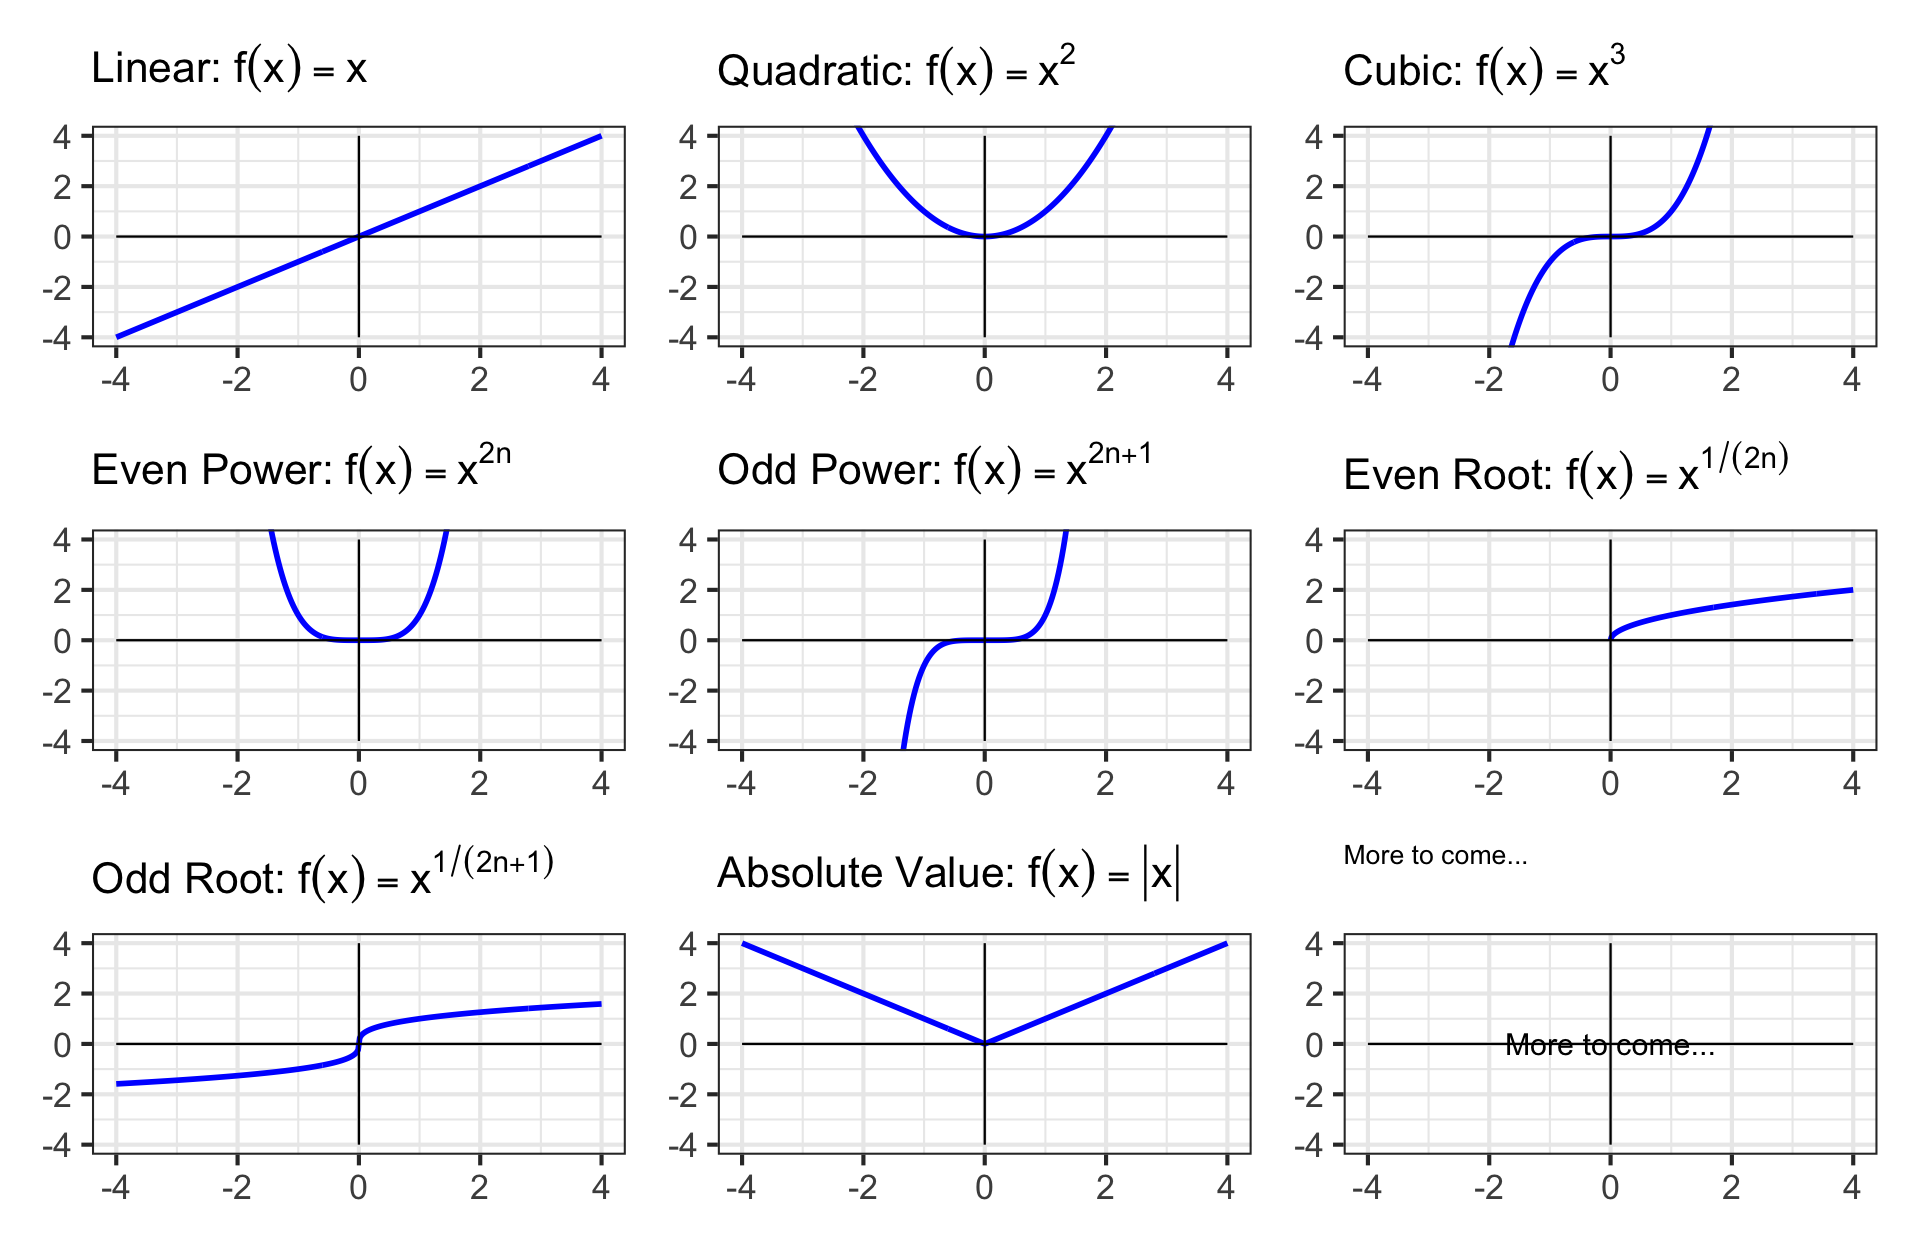
Book Functions
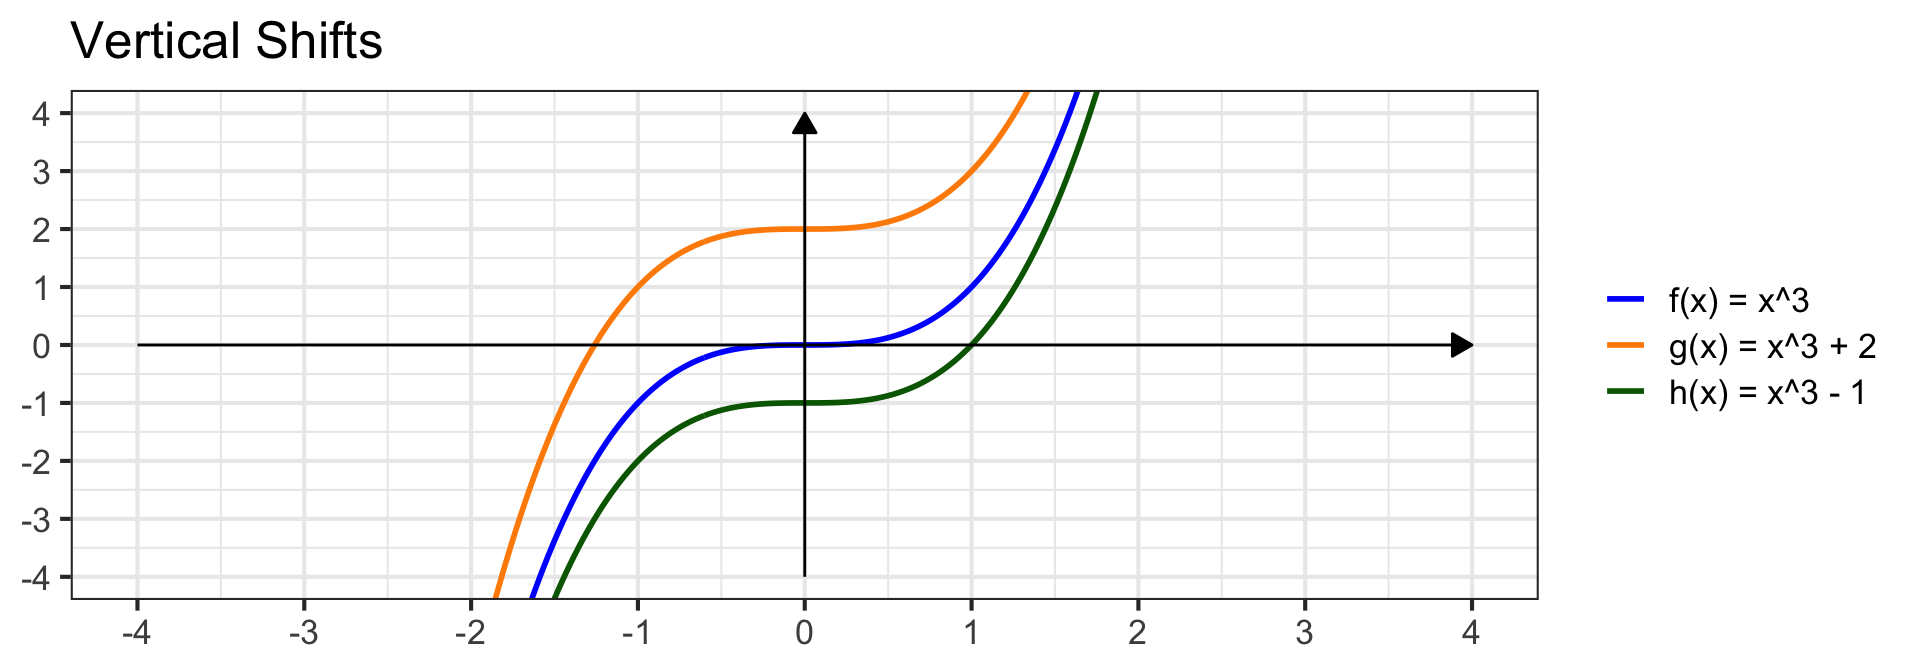
Vertical Shifts
Definition (Vertical Shift): If \(g\left(x\right) = f\left(x\right) + k\), then the graph of \(g\) is the graph of \(f\) shifted up by \(k\) units (or down if \(k < 0\)).
Completed Example 1: Consider \(f\left(x\right) = x^3\), \(g\left(x\right) = x^3 + 2\), and \(h\left(x\right) = x^3 - 1\).
An interactive version of this plot is available on Desmos.
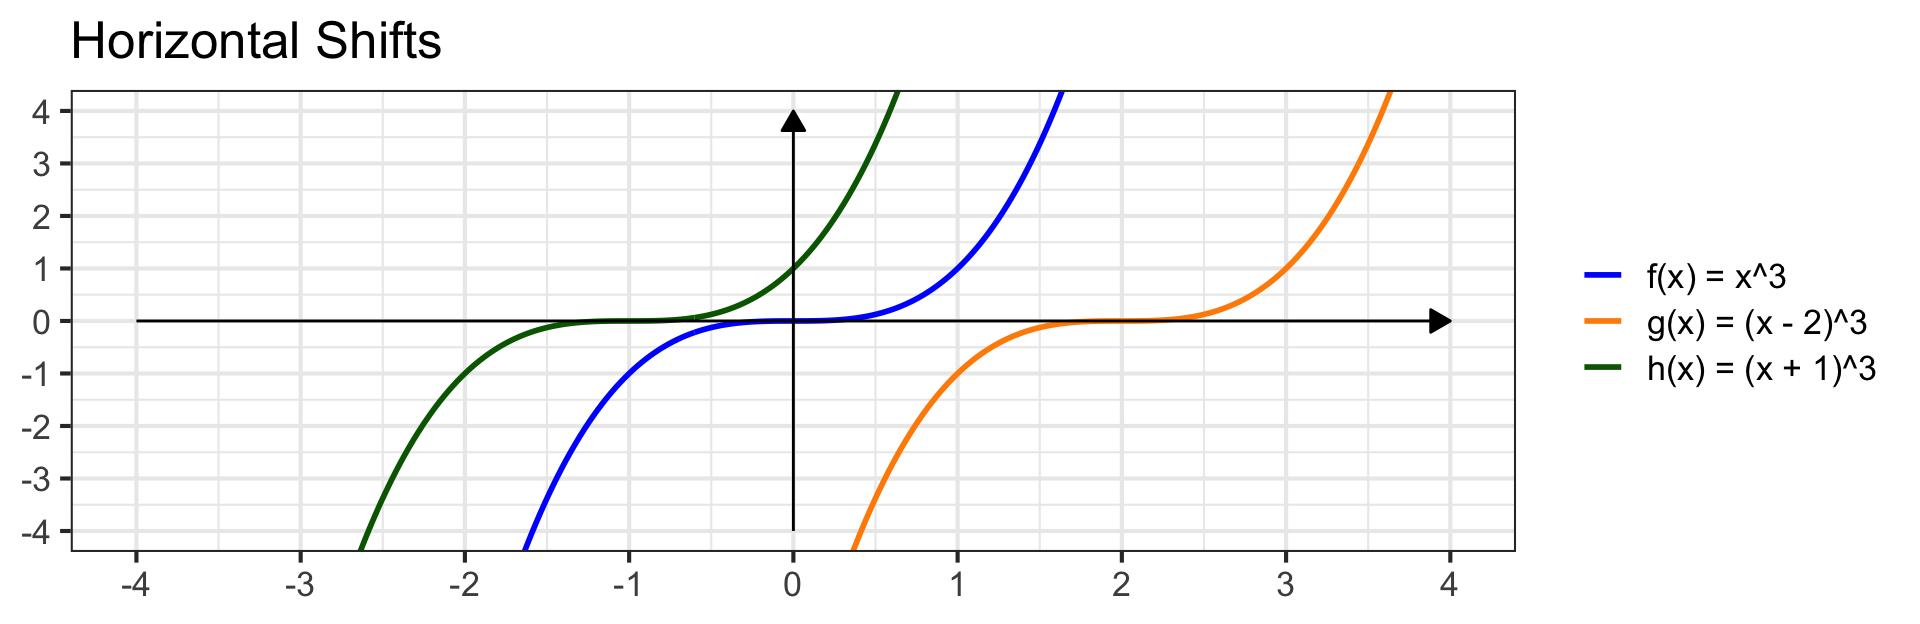
Horizontal Shifts
Definition (Horizontal Shift): If \(g\left(x\right) = f\left(x - h\right)\), then the graph of \(g\) is the graph of \(f\) shifted right by \(h\) units (or left if \(h < 0\)).
Horizontal Shifts are Counter-Intuitive
This is counterintuitive – subtracting inside the argument shifts right, adding shifts left.
Completed Example 2: Consider \(f\left(x\right) = x^3\), \(g\left(x\right) = \left(x - 2\right)^3\), and \(h\left(x\right) = \left(x + 1\right)^3\).
An interactive version is available on Desmos.
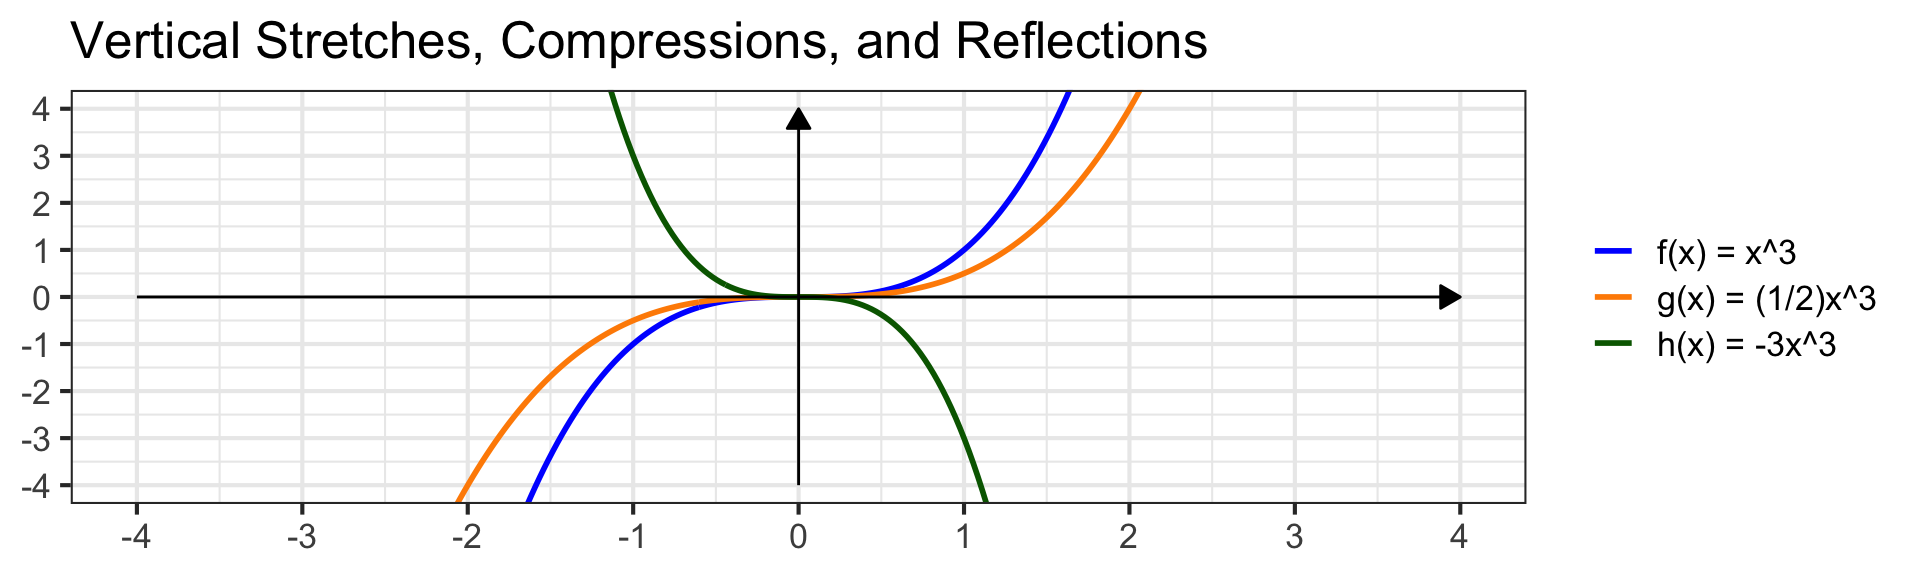
Vertical Stretches, Compressions, and Reflections
Definition (Vertical Stretch): If \(g\left(x\right) = a \cdot f\left(x\right)\), then:
- If \(a > 1\): graph is stretched taller and narrower by factor \(a\).
- If \(0 < a < 1\): graph is compressed shorter and wider by factor \(a\).
- If \(a < 0\): graph is reflected over the \(x\)-axis, then stretched/compressed by \(\left|a\right|\).
Completed Example 3: Consider \(f\left(x\right) = x^3\), \(\displaystyle{g\left(x\right) = \frac{1}{2}x^3}\), and \(h\left(x\right) = -3x^3\).
An interactive version is available on Desmos.
Horizontal Stretches, Compressions, and Reflections
Definition (Horizontal Stretch): If \(g\left(x\right) = f\left(b \cdot x\right)\), then:
- If \(b > 1\): graph is compressed horizontally (the function “speeds up”).
- If \(0 < b < 1\): graph is stretched horizontally (the function “slows down”).
- If \(b < 0\): graph is reflected over the \(y\)-axis, then stretched/compressed by \(\left|b\right|\).
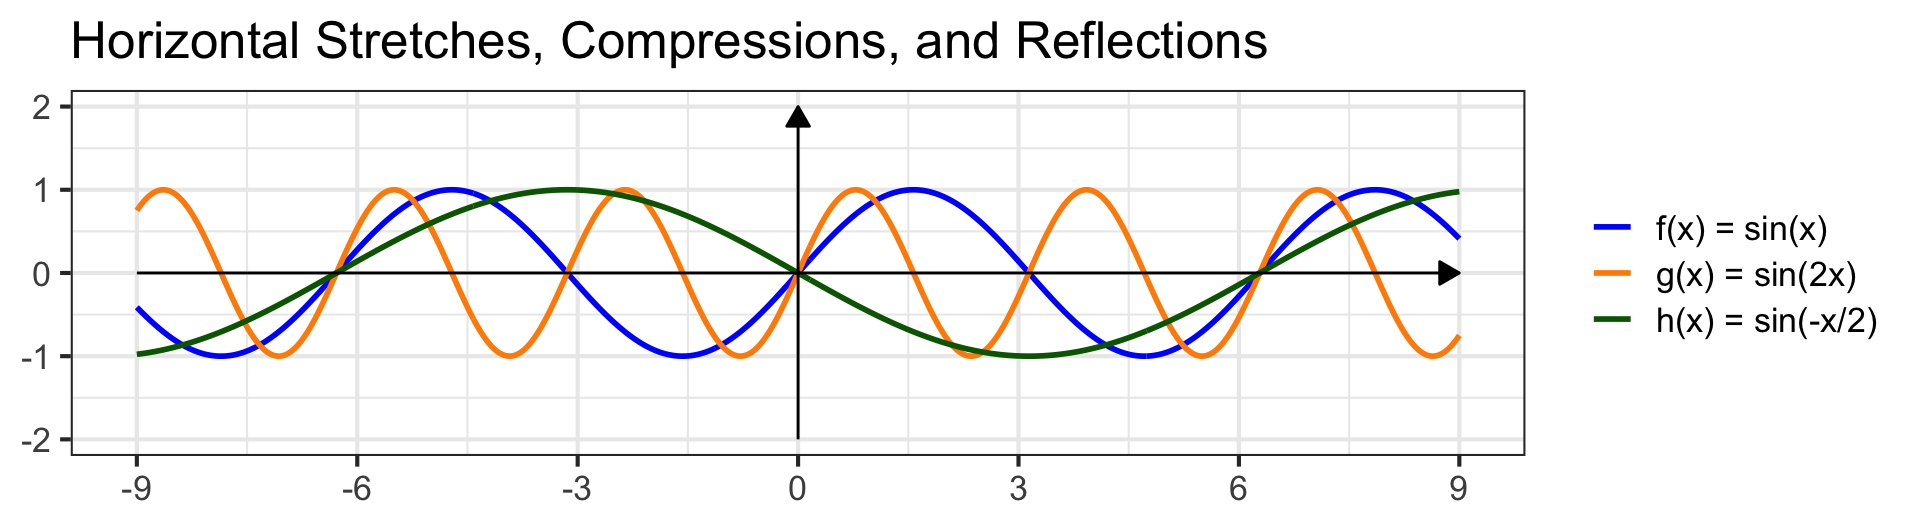
Completed Example 4: We use \(f\left(x\right) = \sin\left(x\right)\) as the base function here since the horizontal effects are easier to see. Compare \(g\left(x\right) = \sin\left(2x\right)\) and \(h\left(x\right) = \sin\!\left(-\frac{1}{2}x\right)\).
An interactive version is available on Desmos.
Putting It All Together
We aren’t restricted to a single transformation at a time. We can combine transformations. The order in which they are applied follows the order of operations.
Completed Example 5: Use transformations to plot \(g\left(x\right) = -2\left(x + 3\right)^2 + 4\).
Solution. Compare to the book function \(f\left(x\right) = x^2\). The transformations occur in this order:
- Shift left by \(3\) units: \(f\left(x + 3\right) = \left(x + 3\right)^2\)
- Reflect over \(x\)-axis and stretch vertically by \(2\): \(-2\left(x + 3\right)^2\)
- Shift up by \(4\) units: \(g\left(x\right) = -2\left(x + 3\right)^2 + 4\)
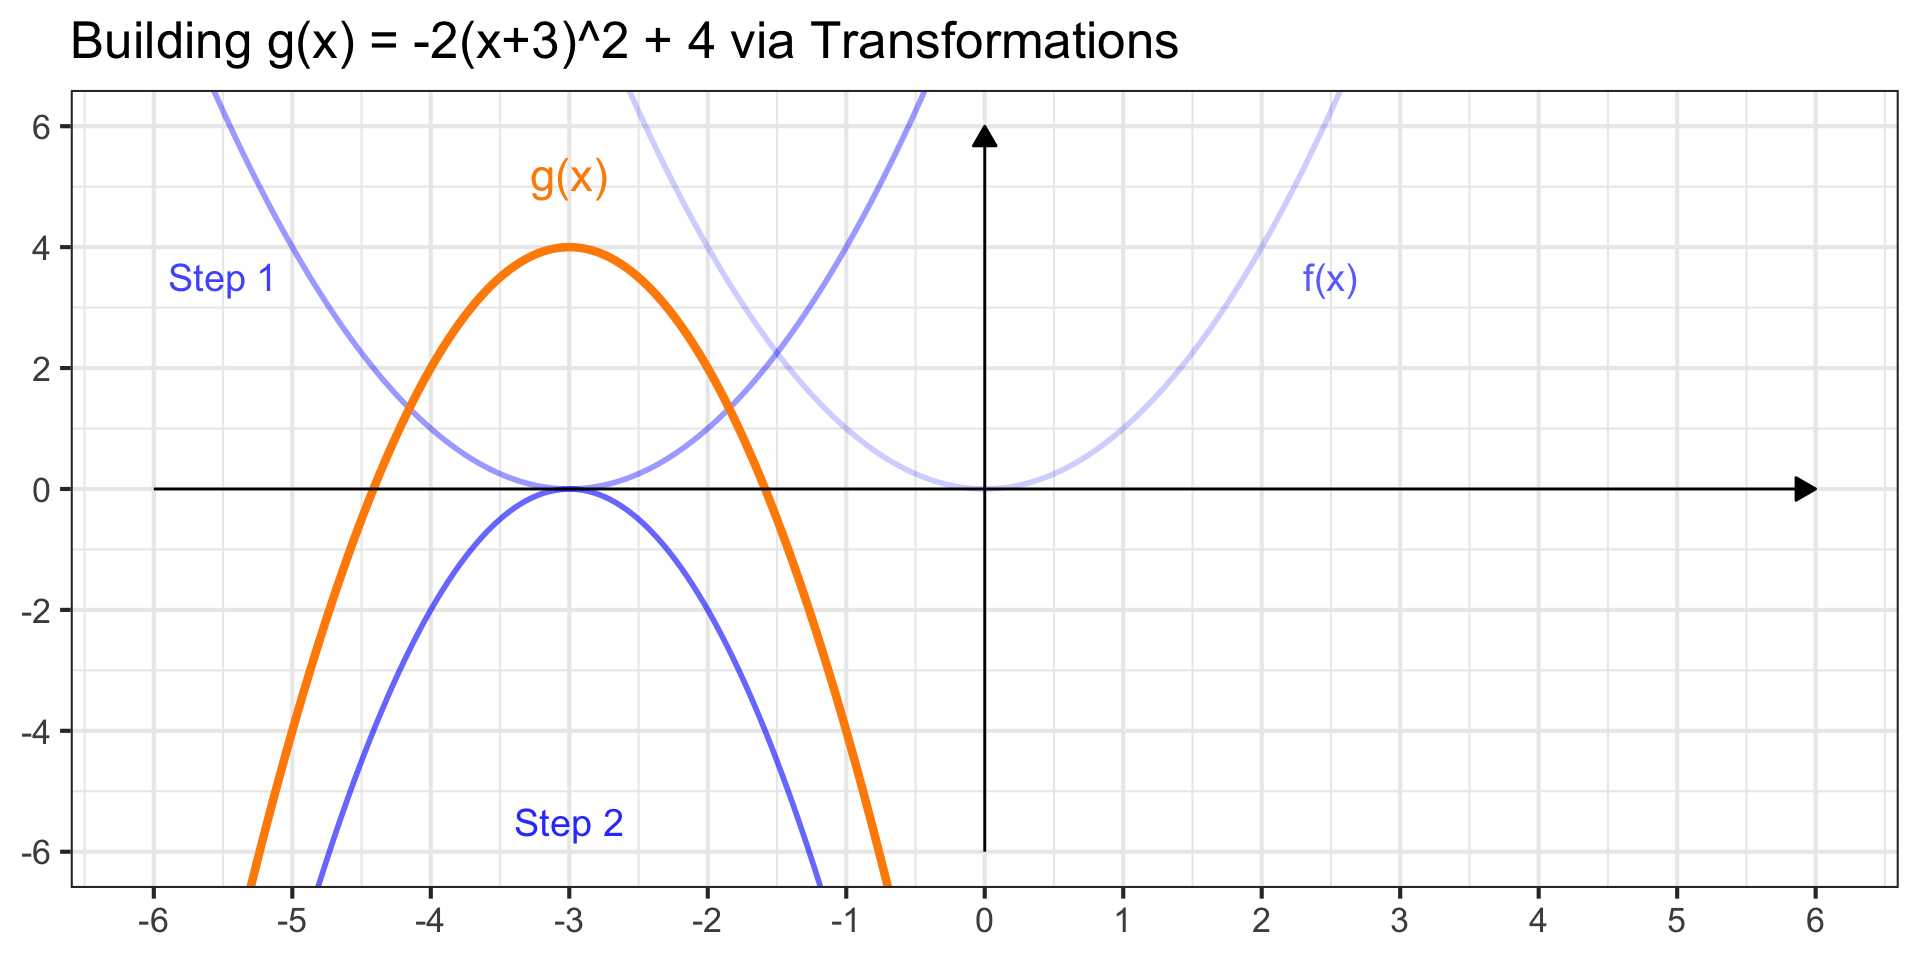
The faded blue curves show the intermediate stages. The final function \(g\left(x\right)\) is in orange. Notice the vertex is now at \(\left(-3, 4\right)\).
Important
Order of operations determines the way in which the transformations are applied. That order matters.
Completed Example 6
Problem: Find the roots, \(y\)-intercept, local maxima and minima, and intervals of increase and decrease for \(f\left(x\right)\).
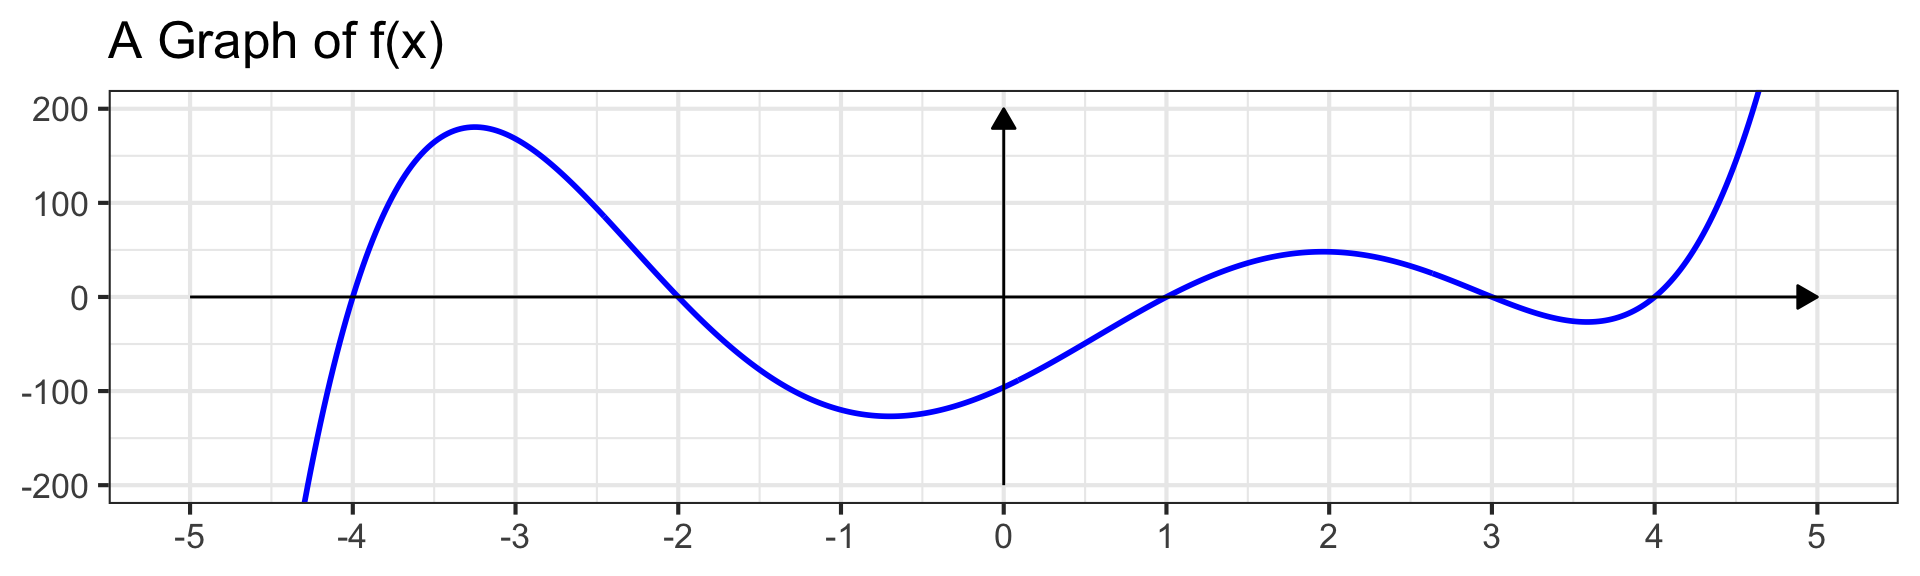
Completed Example 6
Problem: Find the roots, \(y\)-intercept, local maxima and minima, and intervals of increase and decrease for \(f\left(x\right)\).
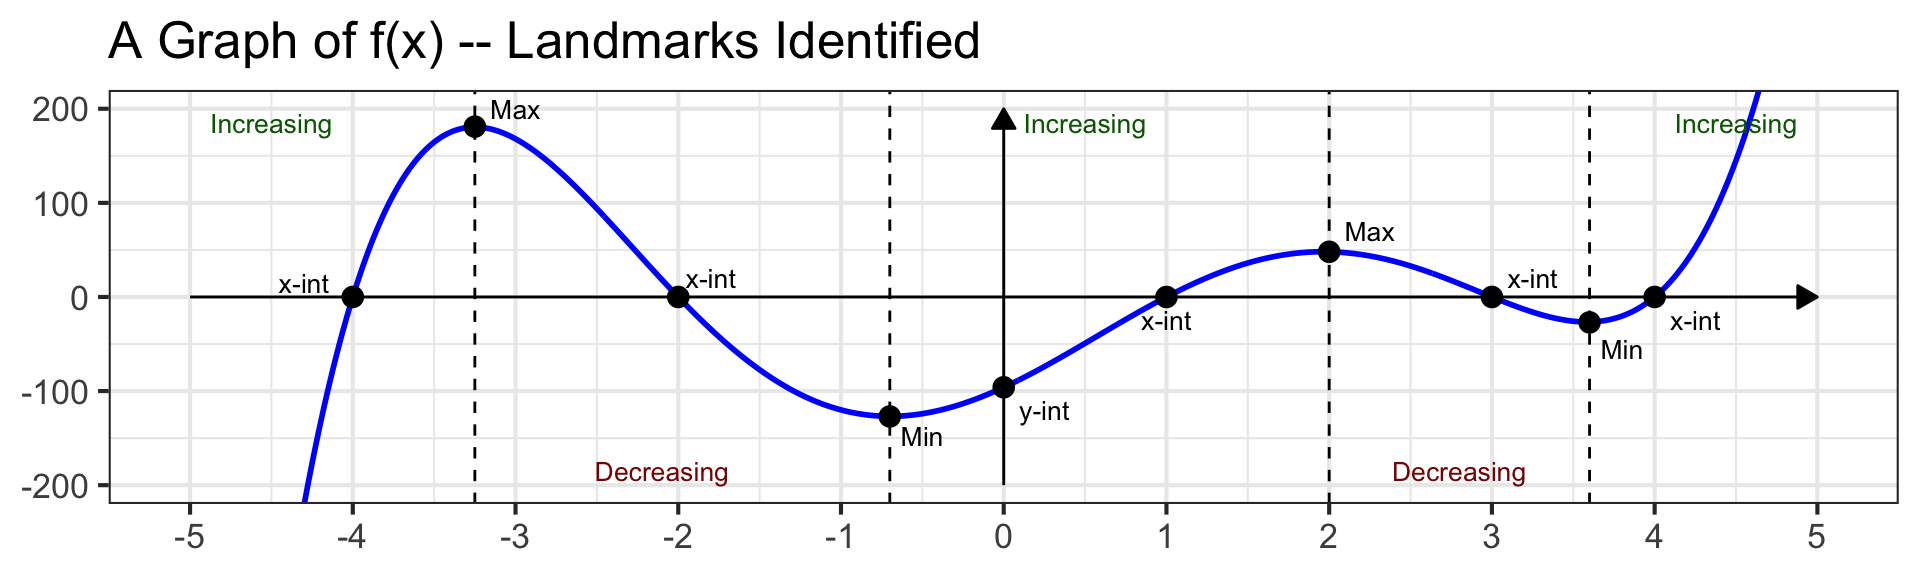
Solution. By inspecting the annotated graph (approximations, not exact values):
- Roots: \(\left(-4, 0\right)\), \(\left(-2, 0\right)\), \(\left(1, 0\right)\), \(\left(3, 0\right)\), \(\left(4, 0\right)\)
- \(y\)-intercept: \(\left(0, -96\right)\)
- Increasing on approximately \(\left(-\infty, -3.25\right)\cup\left(-0.75, 2\right)\cup\left(3.6, \infty\right)\)
- Decreasing on approximately \(\left(-3.25, -0.75\right)\cup\left(2, 3.6\right)\)
- Local maxima near \(\left(-3.25, 181\right)\) and \(\left(2, 48\right)\)
- Local minima near \(\left(-0.75, -127\right)\) and \(\left(3.6, -27\right)\)
Exit Ticket Task
Navigate to our MAT142 Exit Ticket Form, answer the questions, and complete the task below.
Note. Today’s discussion is listed as 6. Graphing: Book Functions and Transformations

Task: Describe the transformations applied to the book function \(f\left(x\right) = \sqrt{x}\) to obtain \(g\left(x\right) = -3\sqrt{\left(x - 2\right)} + 1\). List them in order and describe the effect of each on the graph.