Probability and the Normal Distribution
January 2, 2026
The Normal Distribution
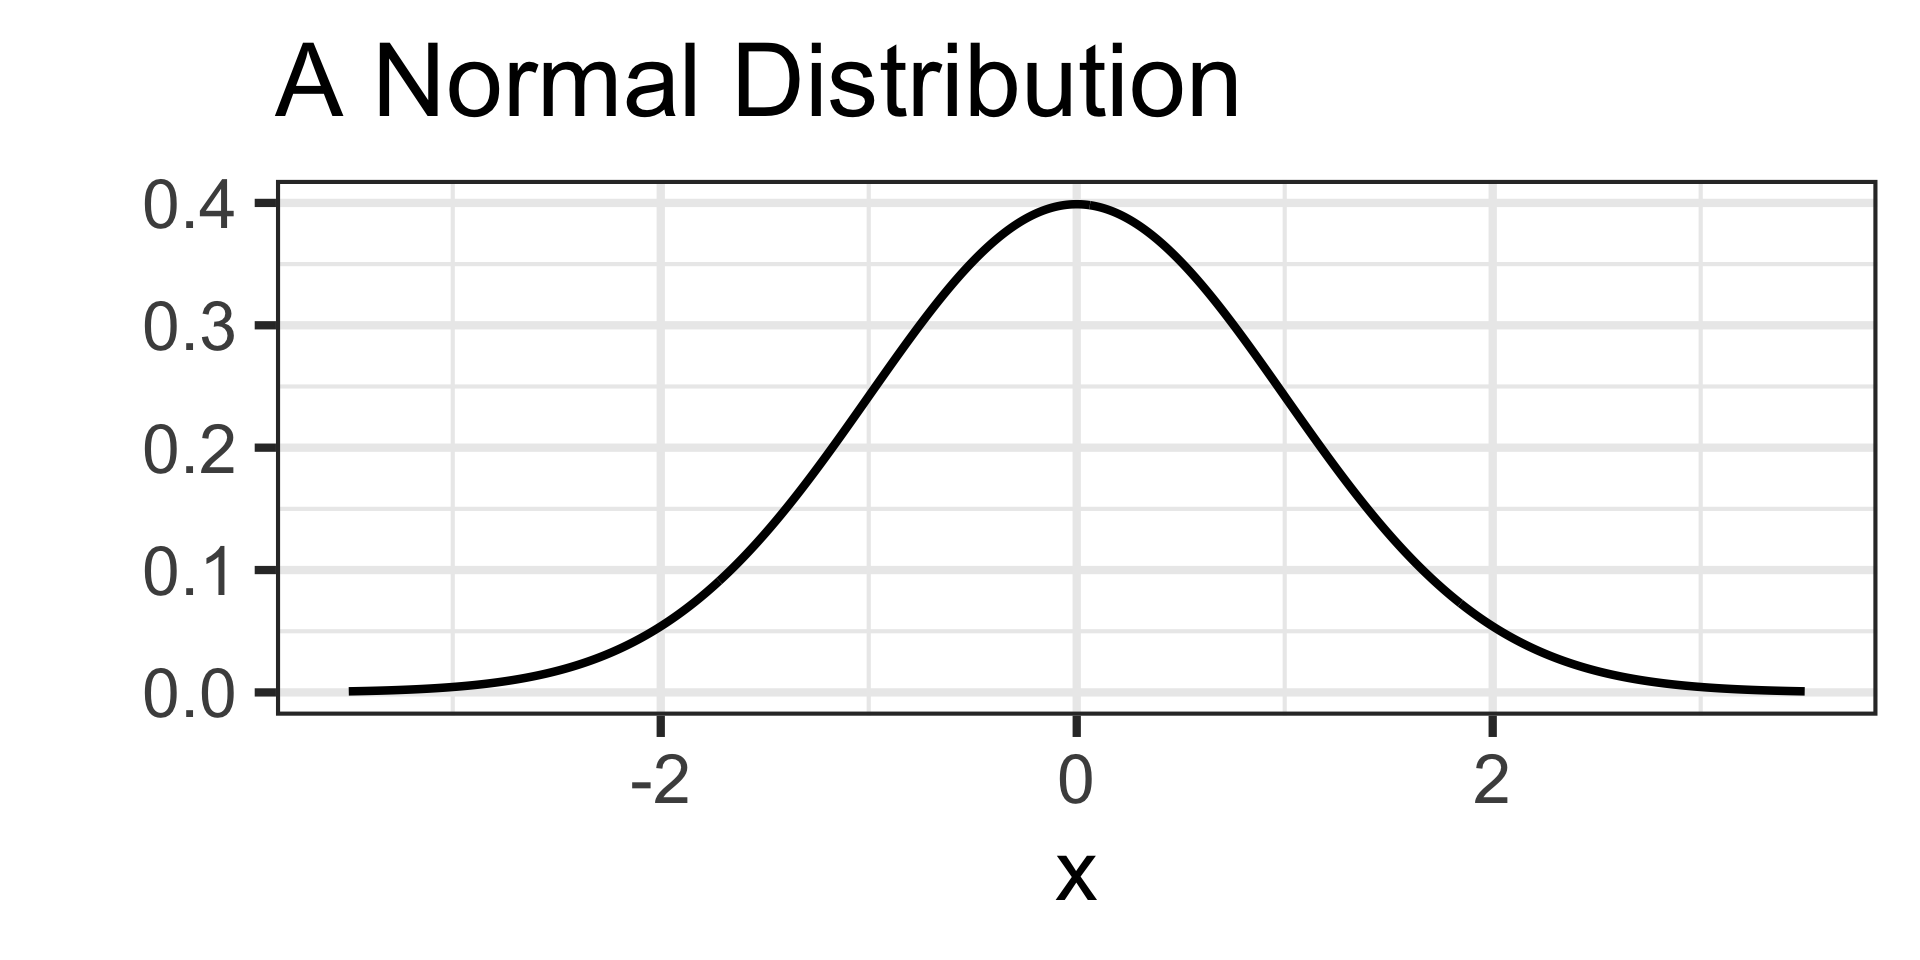
A normal distribution is a bell-shaped distribution which is parameterized (determined) by a mean \(\mu\) and standard deviation \(\sigma\)
The normal distribution with mean \(\mu\) and standard deviation \(\sigma\) is denoted by \(N\left(\mu,~\sigma\right)\) and has probability density function
\[p\left(x\right) = \frac{1}{\sqrt{2\pi\sigma^2}}e^{-\frac{\left(x - \mu\right)^2}{2\sigma^2}}\]
Luckily, like the binomial distribution, we don’t evaluate or work with this distribution by hand either!
Examples of Normal Distributions
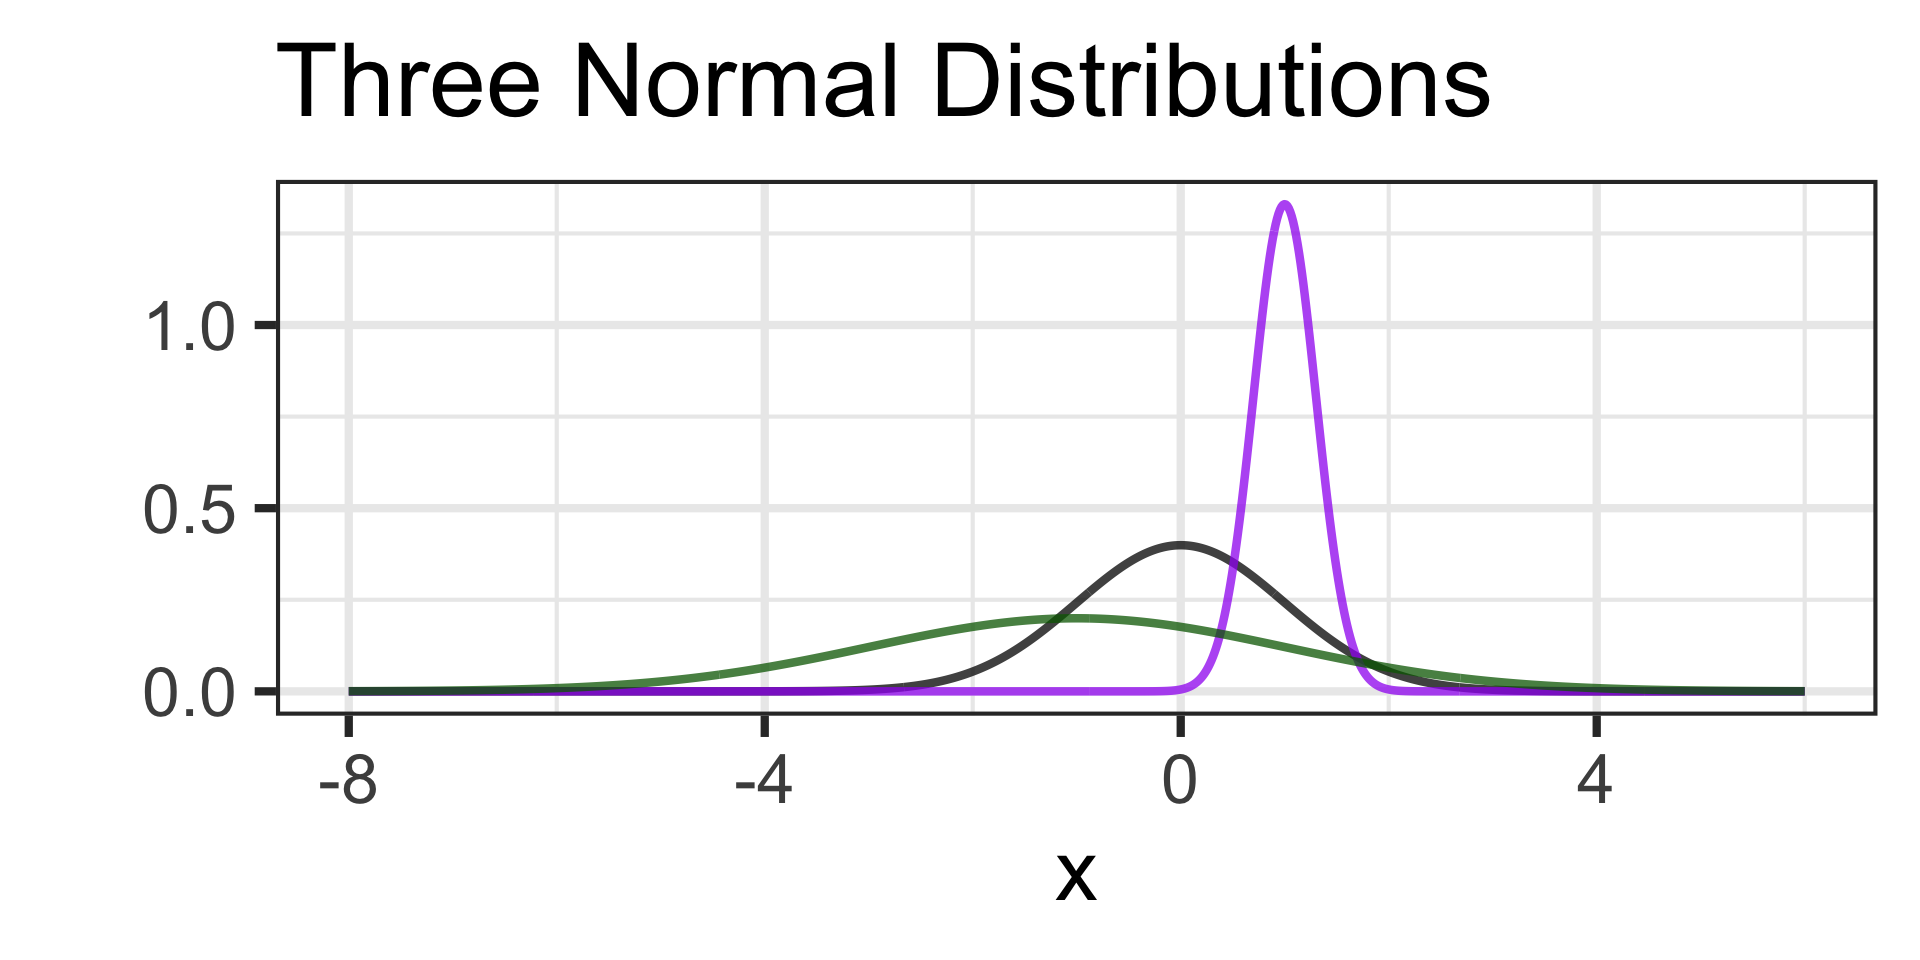
The black distribution has \(\mu = 0\) and \(\sigma = 1\)
The purple distribution has \(\mu = 1\) and \(\sigma = 0.3\)
The green distribution has \(\mu = -1\) and \(\sigma = 2\)
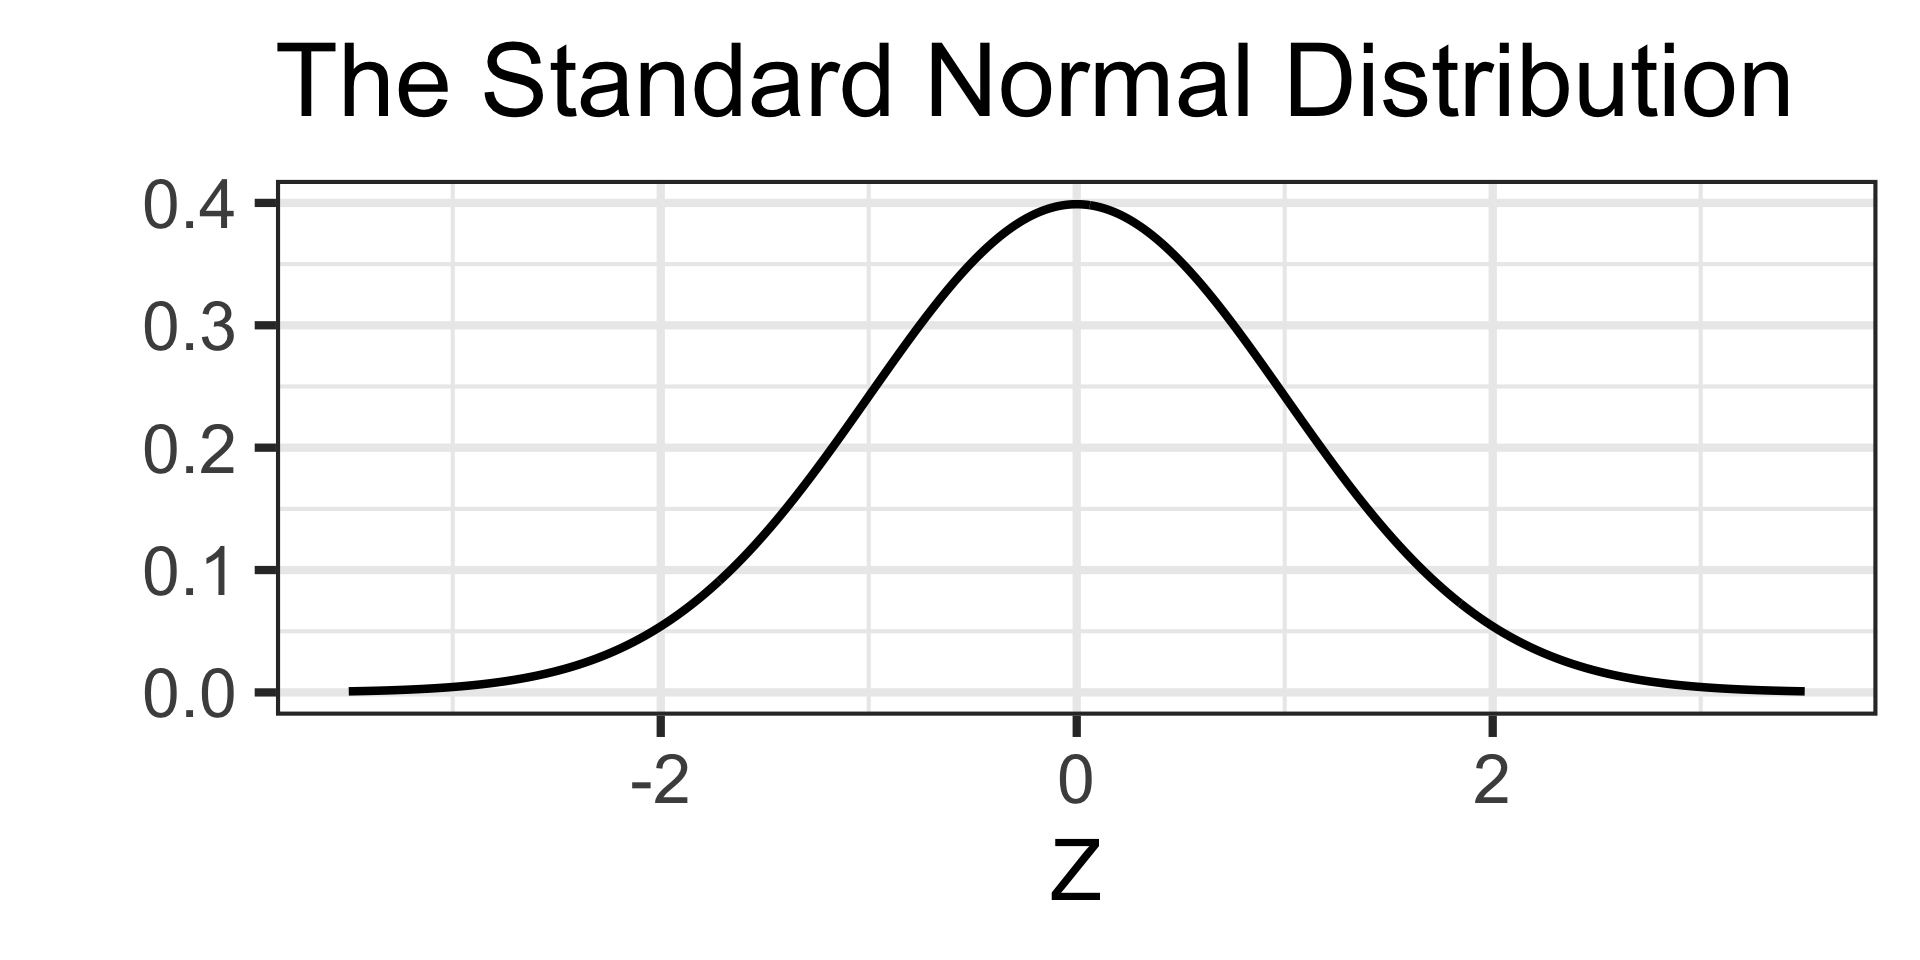
The black distribution, \(N\left(\mu = 0,~\sigma = 1\right)\), is a special distribution called the standard normal distribution and we often use \(z\) to denote its “support” values.
We’ll encounter this distribution quite often throughout our course.
The Center of the Normal Distribution
All of the distributions below have standard deviation \(\sigma = 2\) but they have different means (\(\mu\))
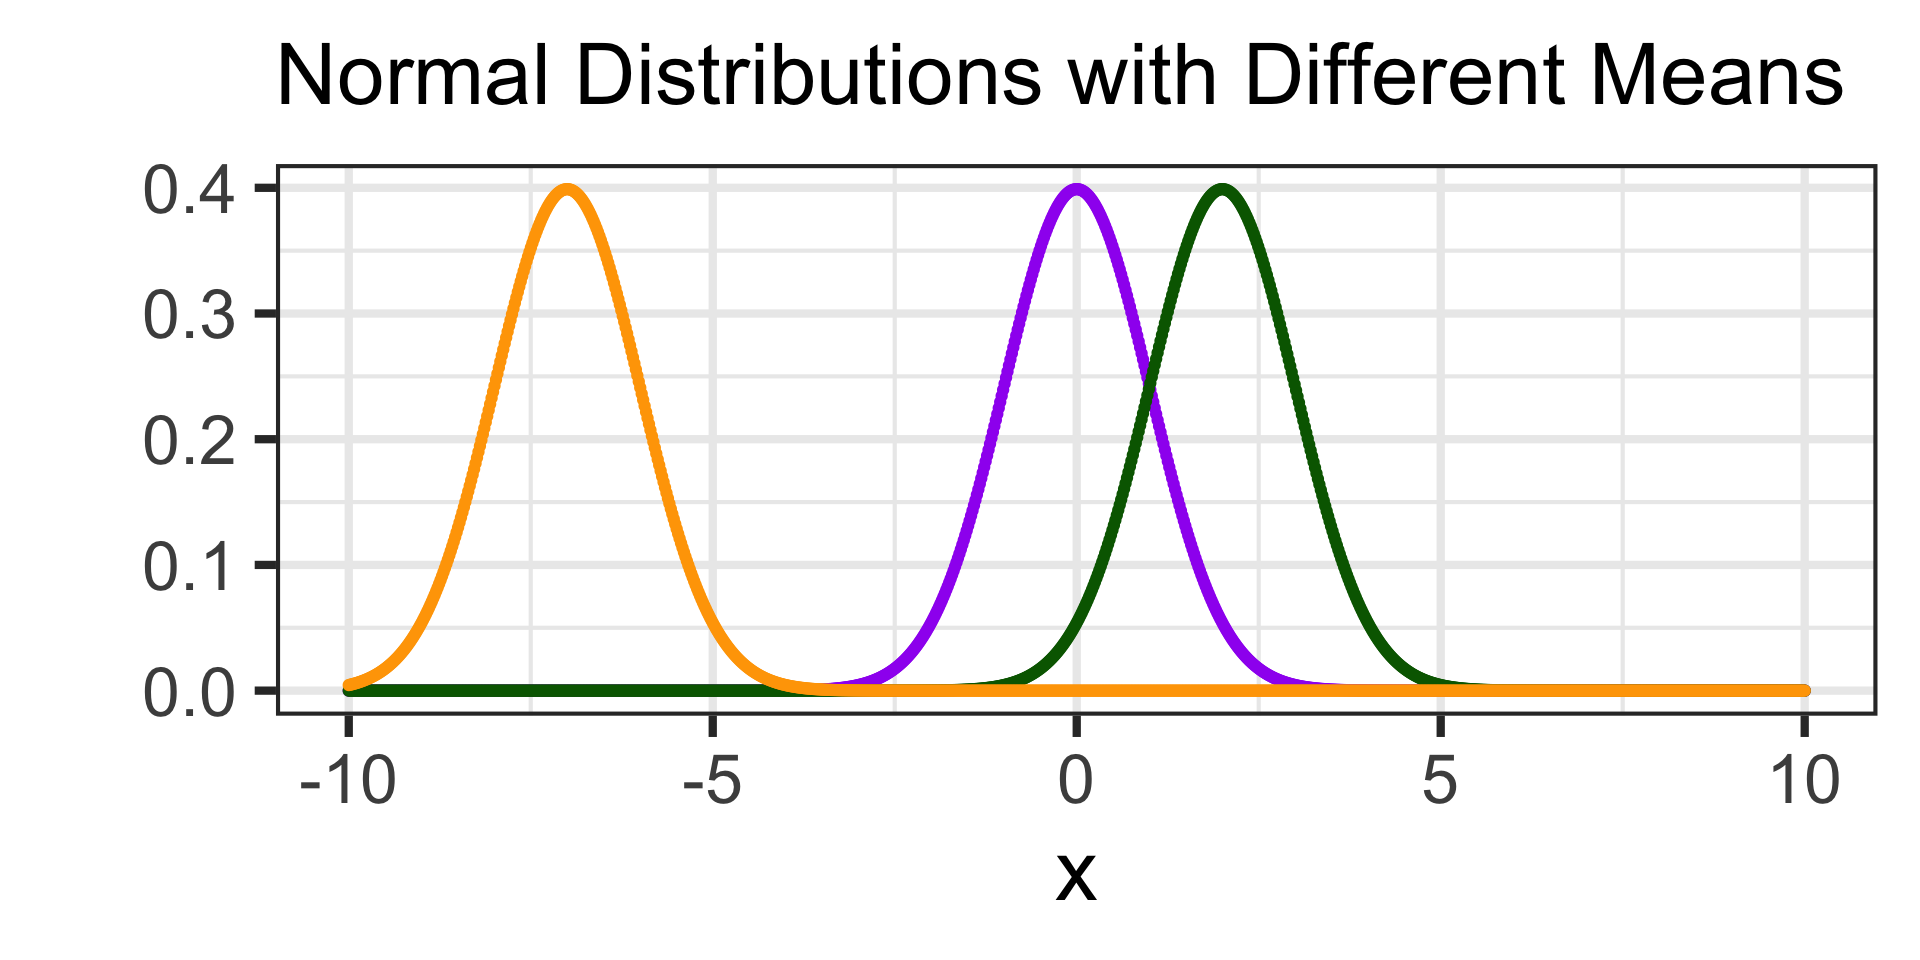
- The mean of the purple distribution is \(\mu = 0\)
- The mean of the green distribution is \(\mu = 2\)
- The mean of the orange distribution is \(\mu = -7\)
Note: All three distributions have the same shape, but are shifted so that their peak is at their mean.
The Spread of the Normal Distribution
All of the distributions below have mean \(\mu = 0\) but they have different standard deviations (\(\sigma\))
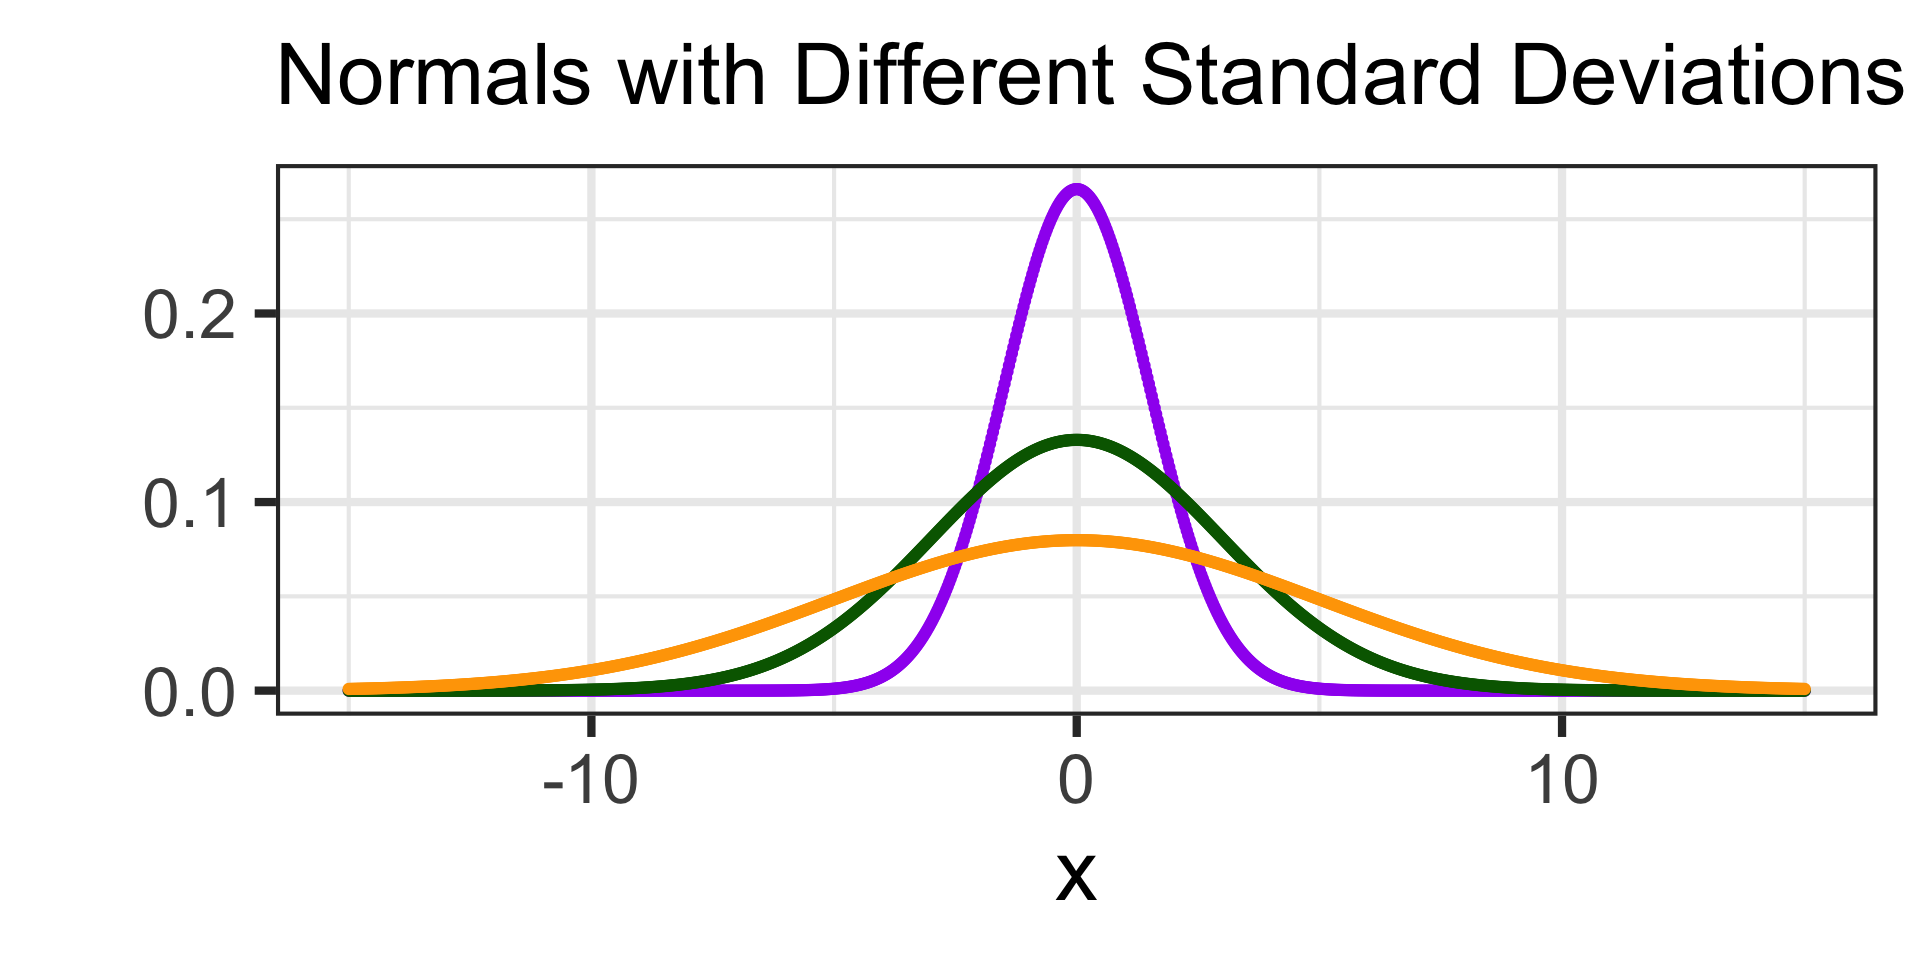
- The standard deviation of the purple distribution is \(\sigma = 1.5\)
- The standard deviation of the green distribution is \(\sigma = 3\)
- The standard deviation of the orange distribution is \(\sigma = 5\)
Note: All of these distributions have the same center, but their width (and height too) change depending on their standard deviation.
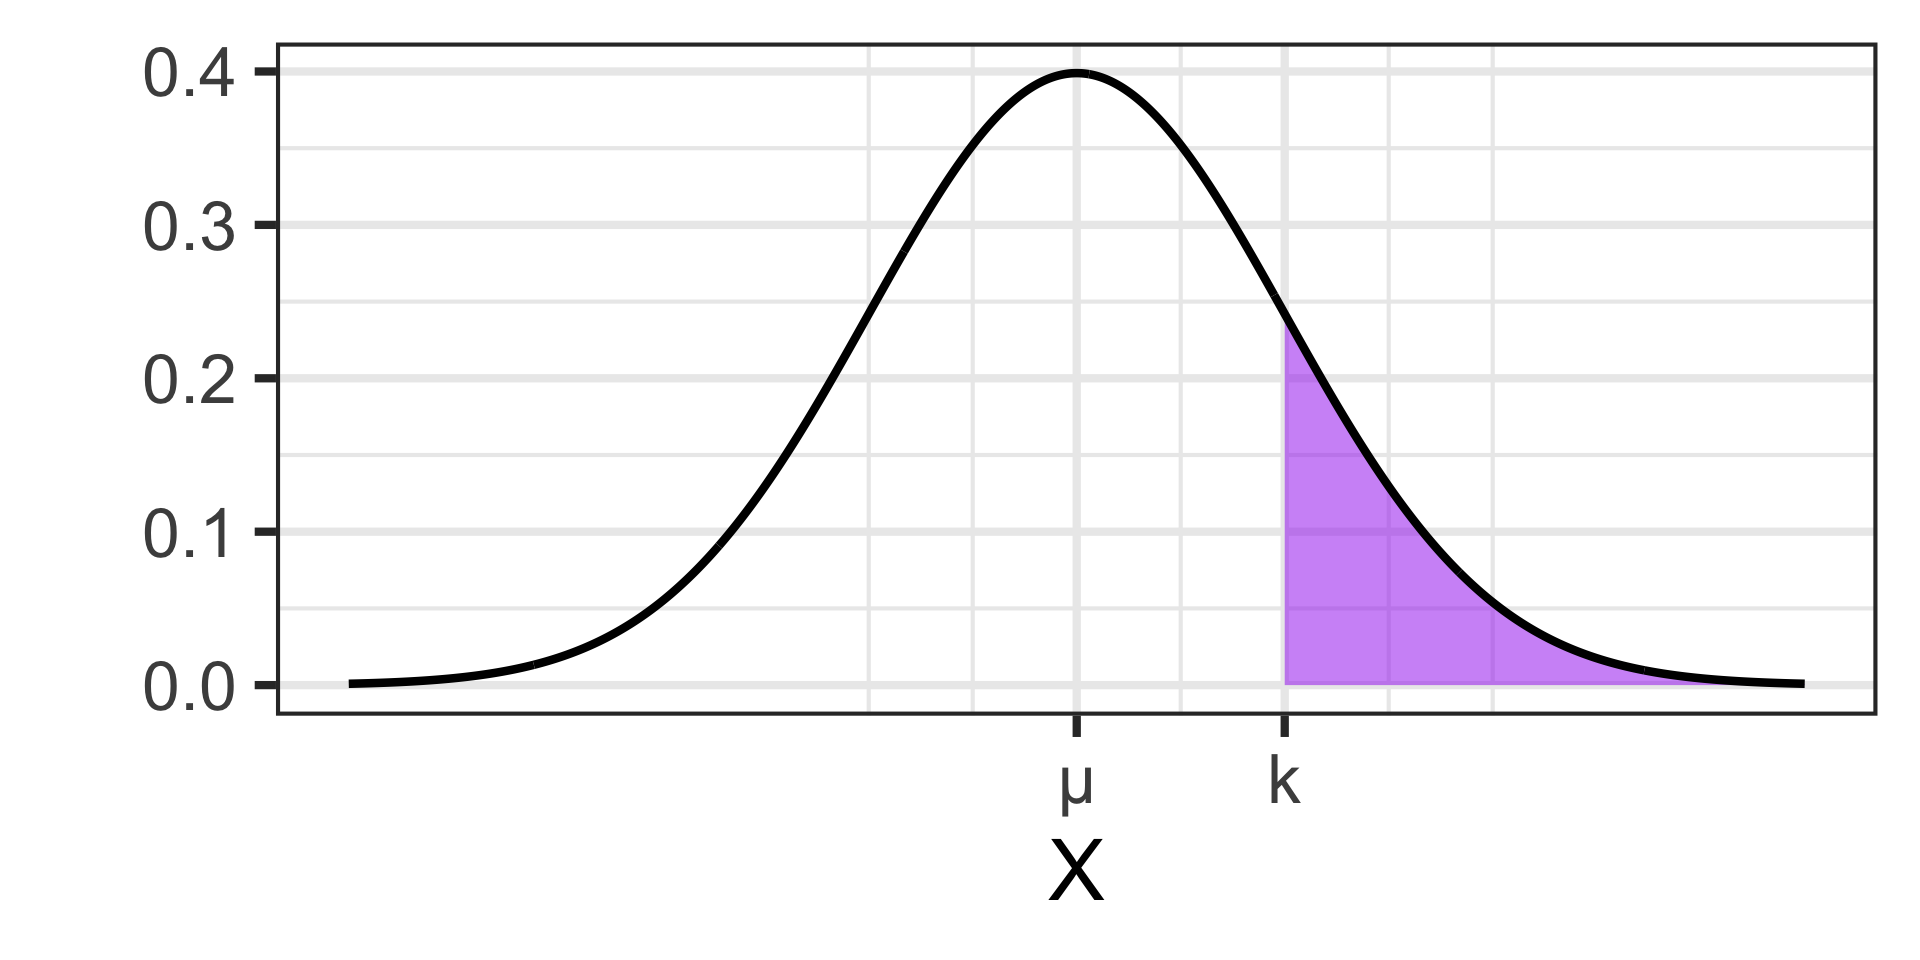
Probabilities and the Normal Distribution
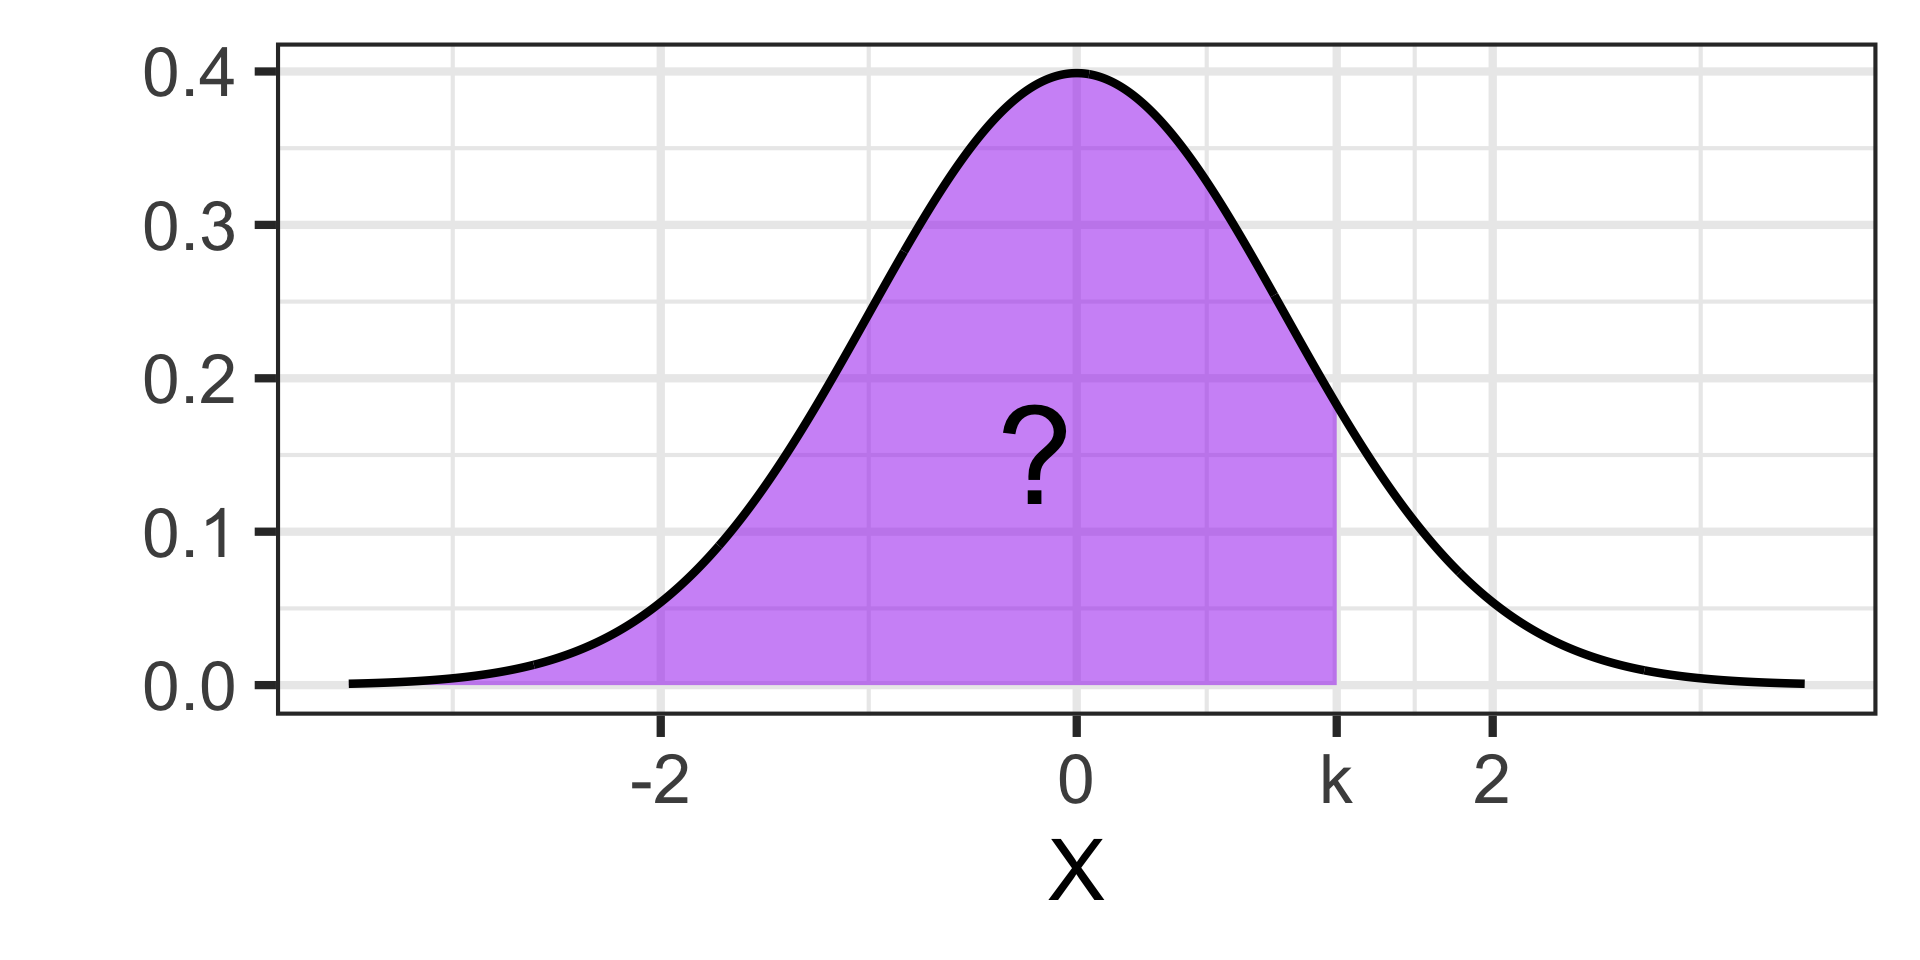
Probabilities of outcomes from random variables described by a normal distribution are areas under the corresponding normal curve.
The picture to the right shows \(\mathbb{P}\left[X \geq k\right]\)
Note: It is also worth knowing that the Normal Distribution is symmetric
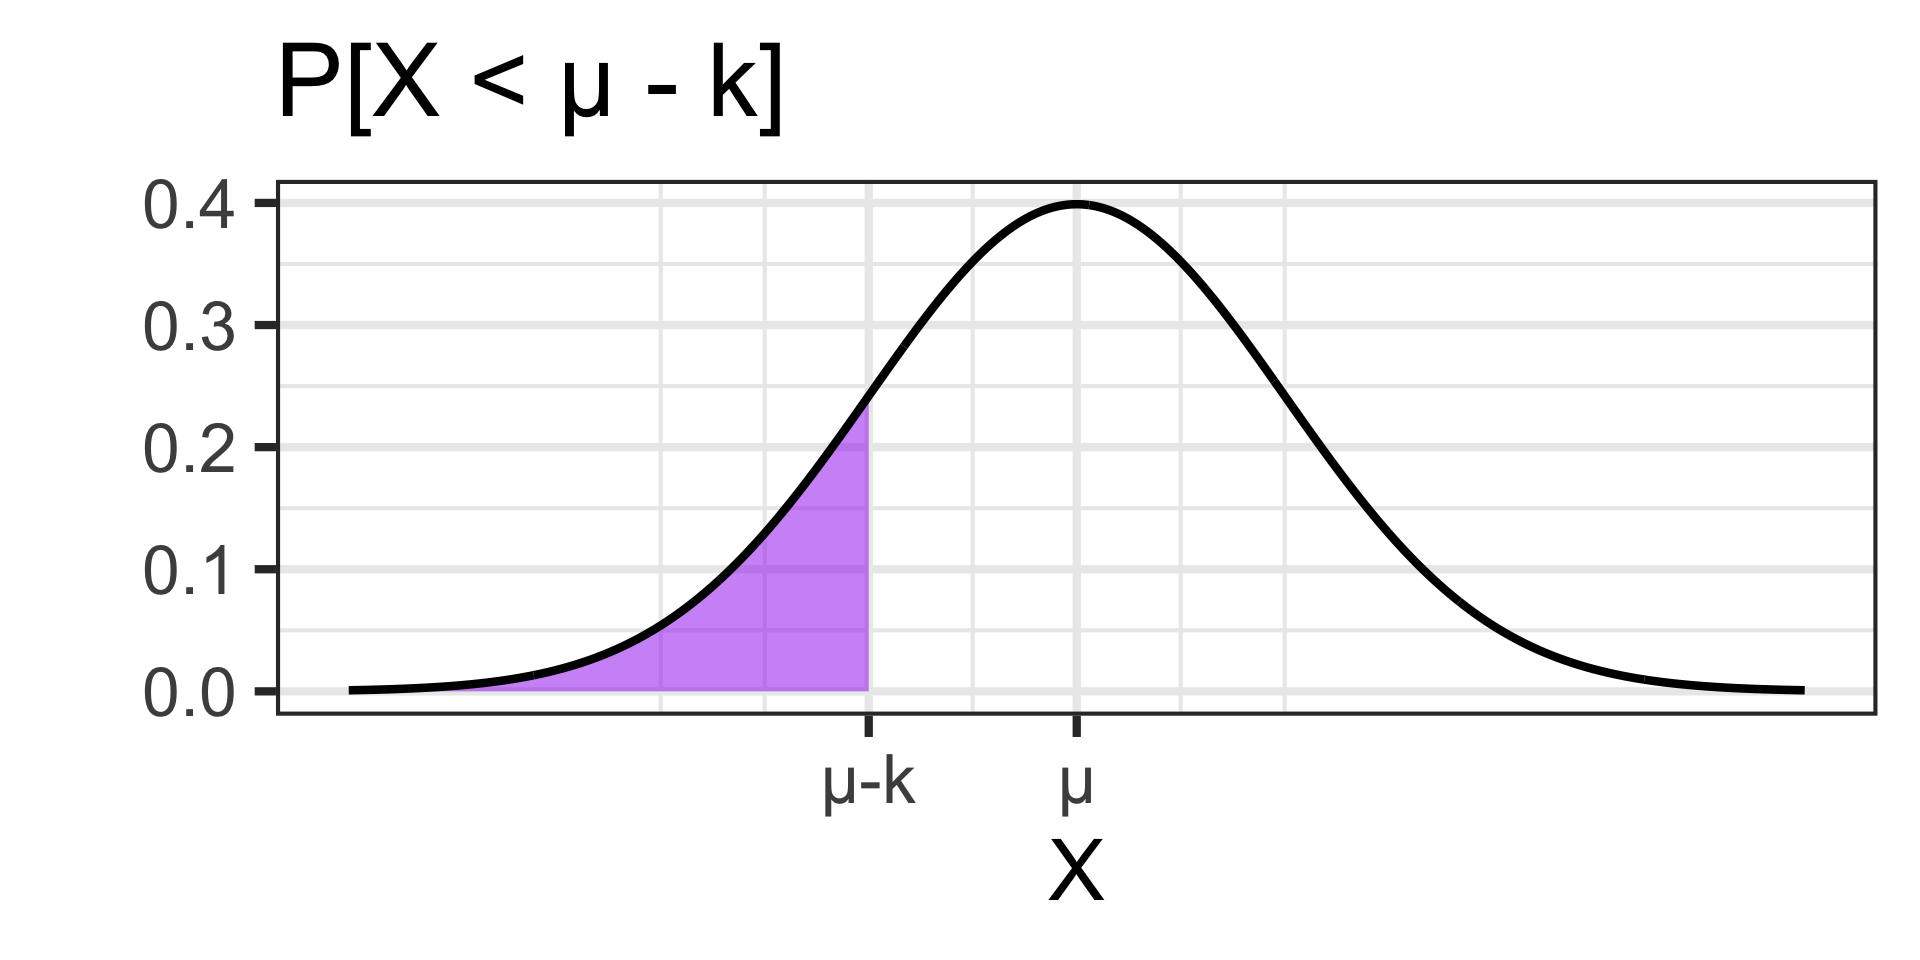
is the same as…
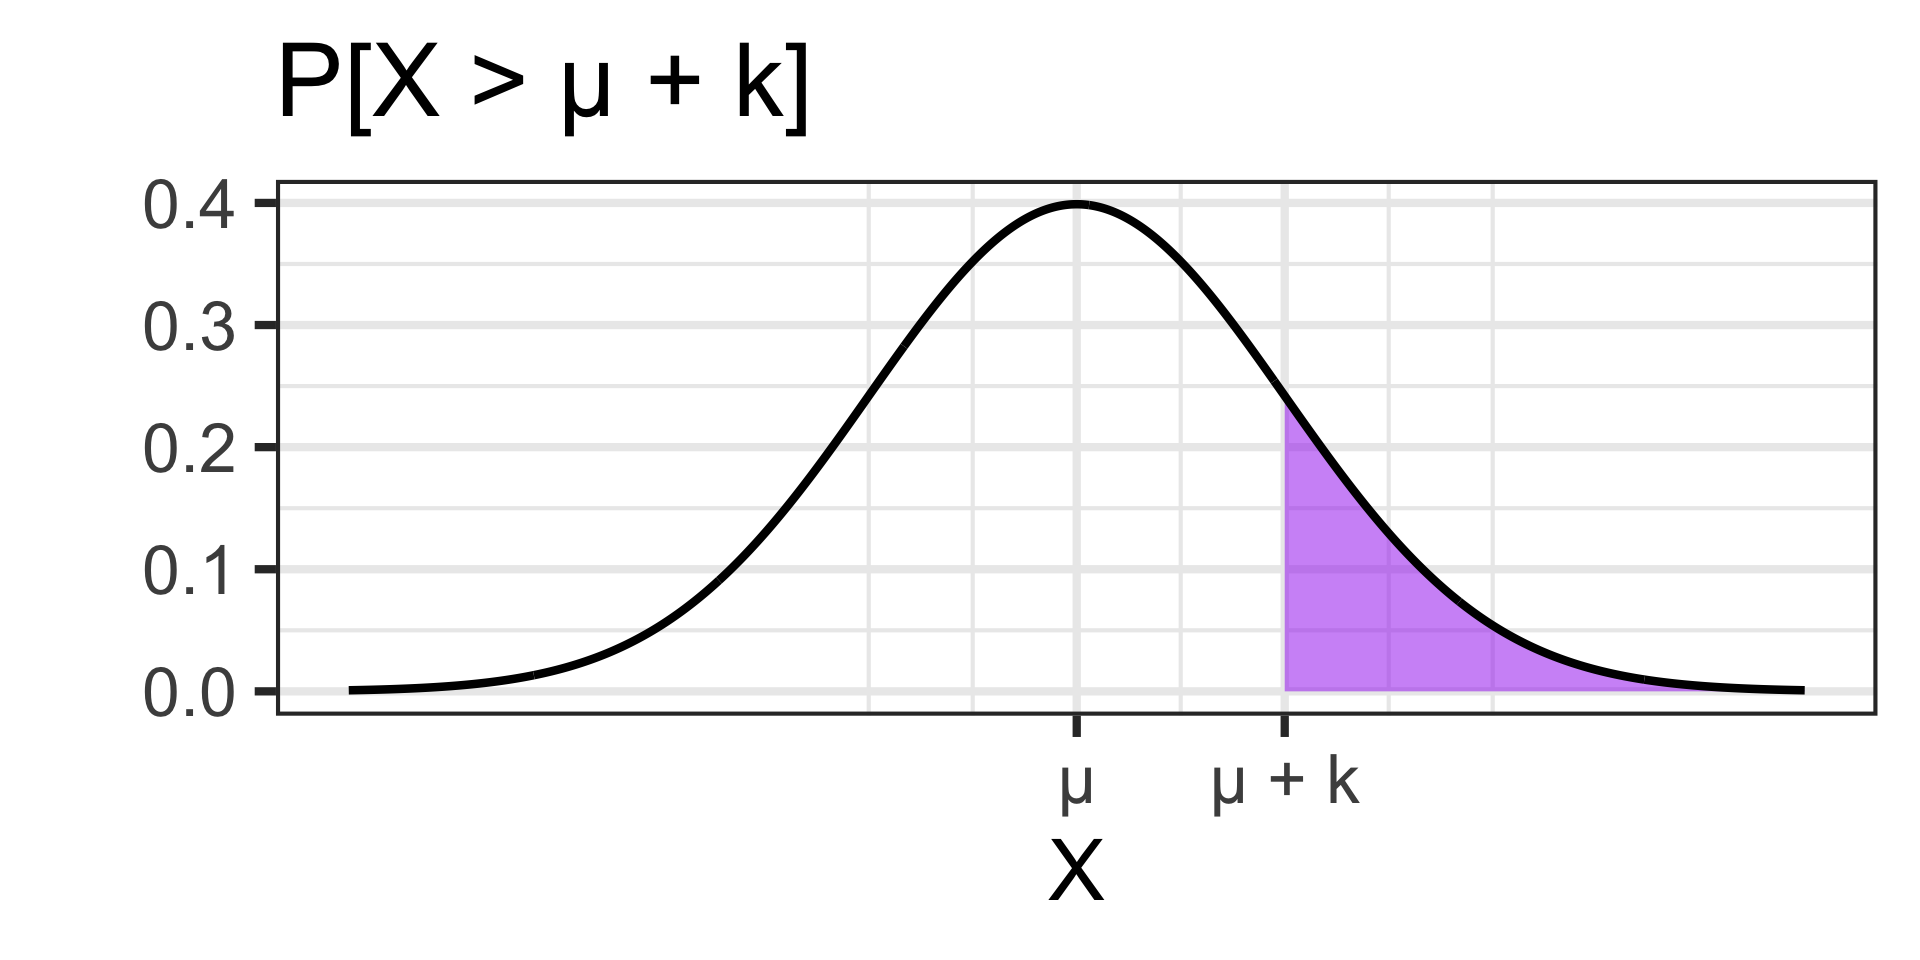
Note: If \(\mu = 0\), then this relationship simplifies to \(\mathbb{P}\left[X < -k\right] = \mathbb{P}\left[X > k\right]\) – but be careful, this is only true when \(\mu = 0\).
Probability of an Exact, Singular Outcome is 0
Question: What is the probability that a randomly selected adult male from the United States is exactly 72 inches (6 feet) tall?
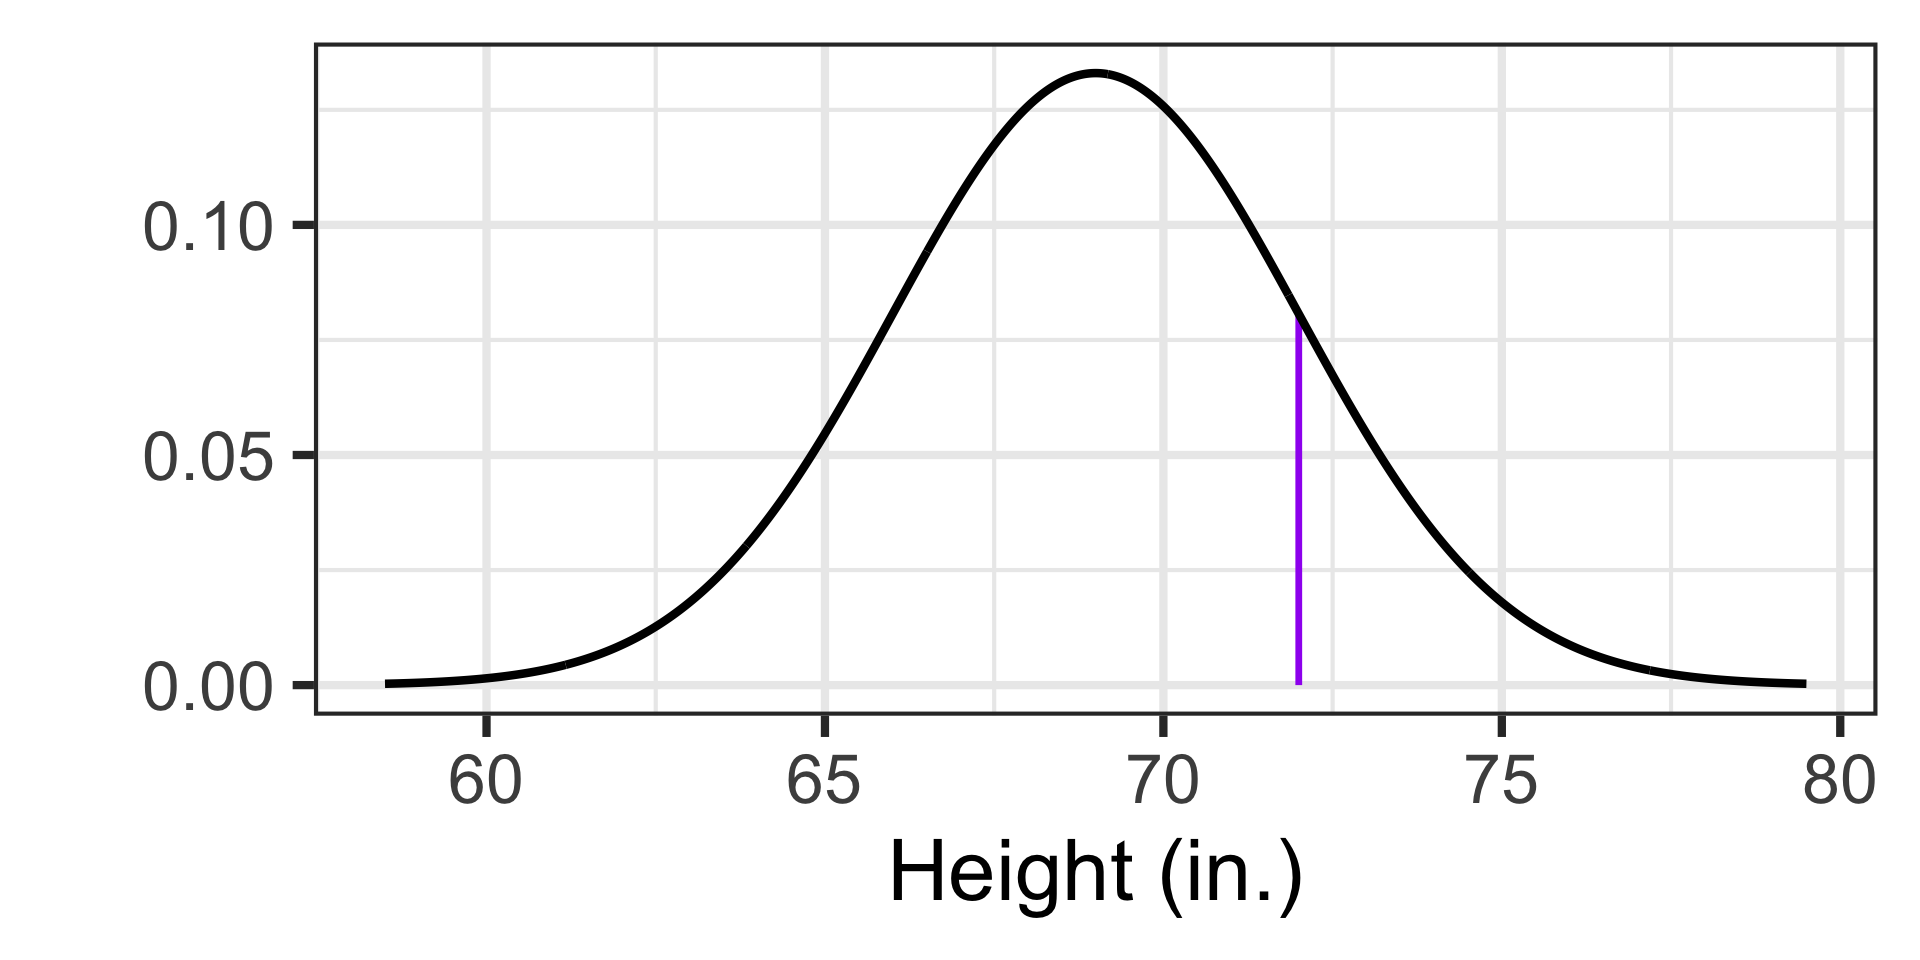
Since probabilities are areas under the curve and we can approximate this region by a rectangle, we can use the formula for the area of a rectangle to approximate this probability! What’s the area of a rectangle with 0 width?
Note: For this reason, \(\mathbb{P}\left[X \leq k\right] = \mathbb{P}\left[X < k\right]\) and \(\mathbb{P}\left[X \geq k\right] = \mathbb{P}\left[X > k\right]\).
If we want to estimate probabilities, we’ll need to ask questions about ranges of values.
- What is the probability that an adult male in the US is less than 72 inches tall?
- …at least 72 inches tall?
- …between 71.5 and 72.5 inches tall?
Review of R Functionality for the Normal Distribution (Finding Probabilities; pnorm())
Assume that \(X\sim N\left(\mu = \text{mu}, \sigma = \text{sigma}\right)\).
That is, the random variable \(X\) is normally distributed with mean \(\text{mu}\) and standard deviation \(\text{sigma}\).
Since \(\mathbb{P}\left[X = k\right] = 0\) (that is, the probability that the random variable \(X\) takes on the value \(k\) exactly, is 0), we will not make use of any dnorm() function
The probability that \(X\) takes on a value less than or equal to (or just less than) \(k\) is \(\mathbb{P}\left[X \leq k\right] \approx\) pnorm(k, mean = mu, sd = sigma)
In cases where we want to find \(\mathbb{P}\left[x \geq k\right]\), \(\mathbb{P}\left[k_1 \leq X\leq k_2\right]\), and others, we’ll need to…
Strategy: Draw a picture and let your picture tell you how to use pnorm()
Review of R Functionality for the Normal Distribution (Finding Percentiles; qnorm())
Assume that \(X\sim N\left(\mu = \text{mu}, \sigma = \text{sigma}\right)\).
That is, the random variable \(X\) is normally distributed with mean \(\text{mu}\) and standard deviation \(\text{sigma}\).
In addition to computing probabilities, we can compute percentiles/quantiles (cut-off or boundary values)
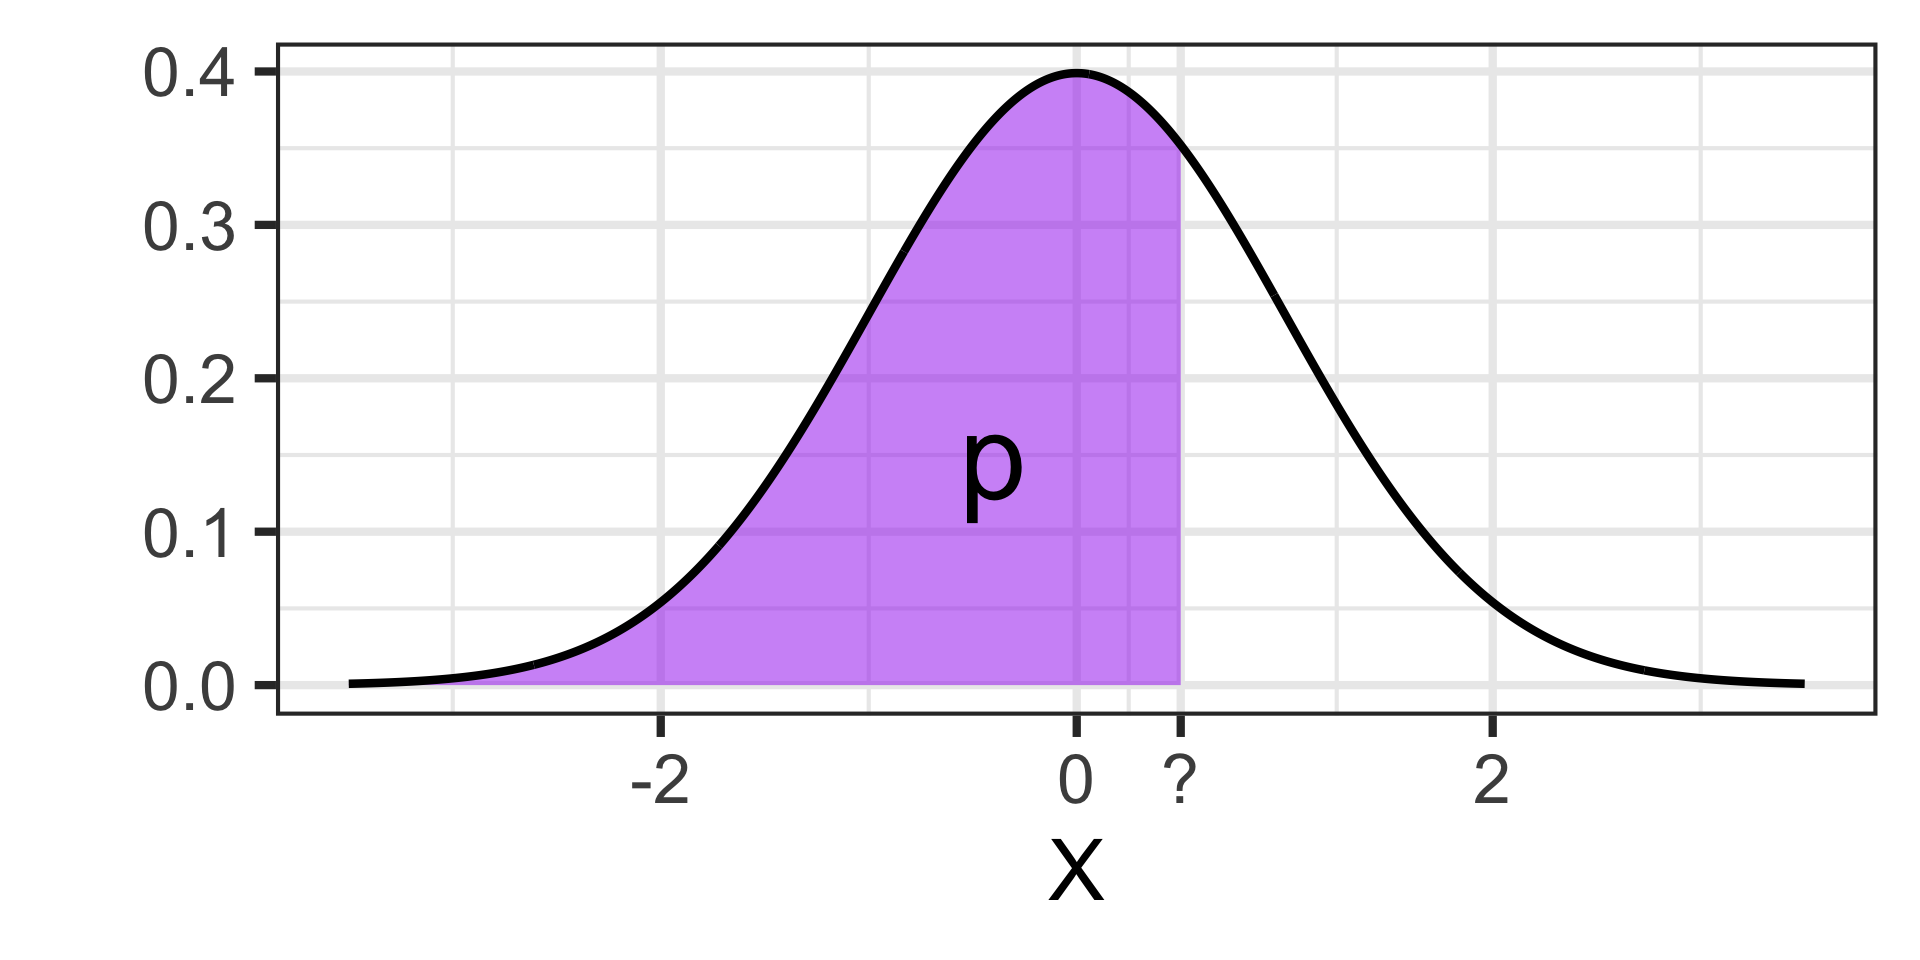
The boundary value \(k^*\) such that \(\mathbb{P}\left[X \leq k^*\right] = p\) is given by
qnorm(p, mean = mu, sd = sigma)
Note: \(p\) must be the area to the LEFT of the boundary value your are looking for
Examples: Working with the Normal Distribution
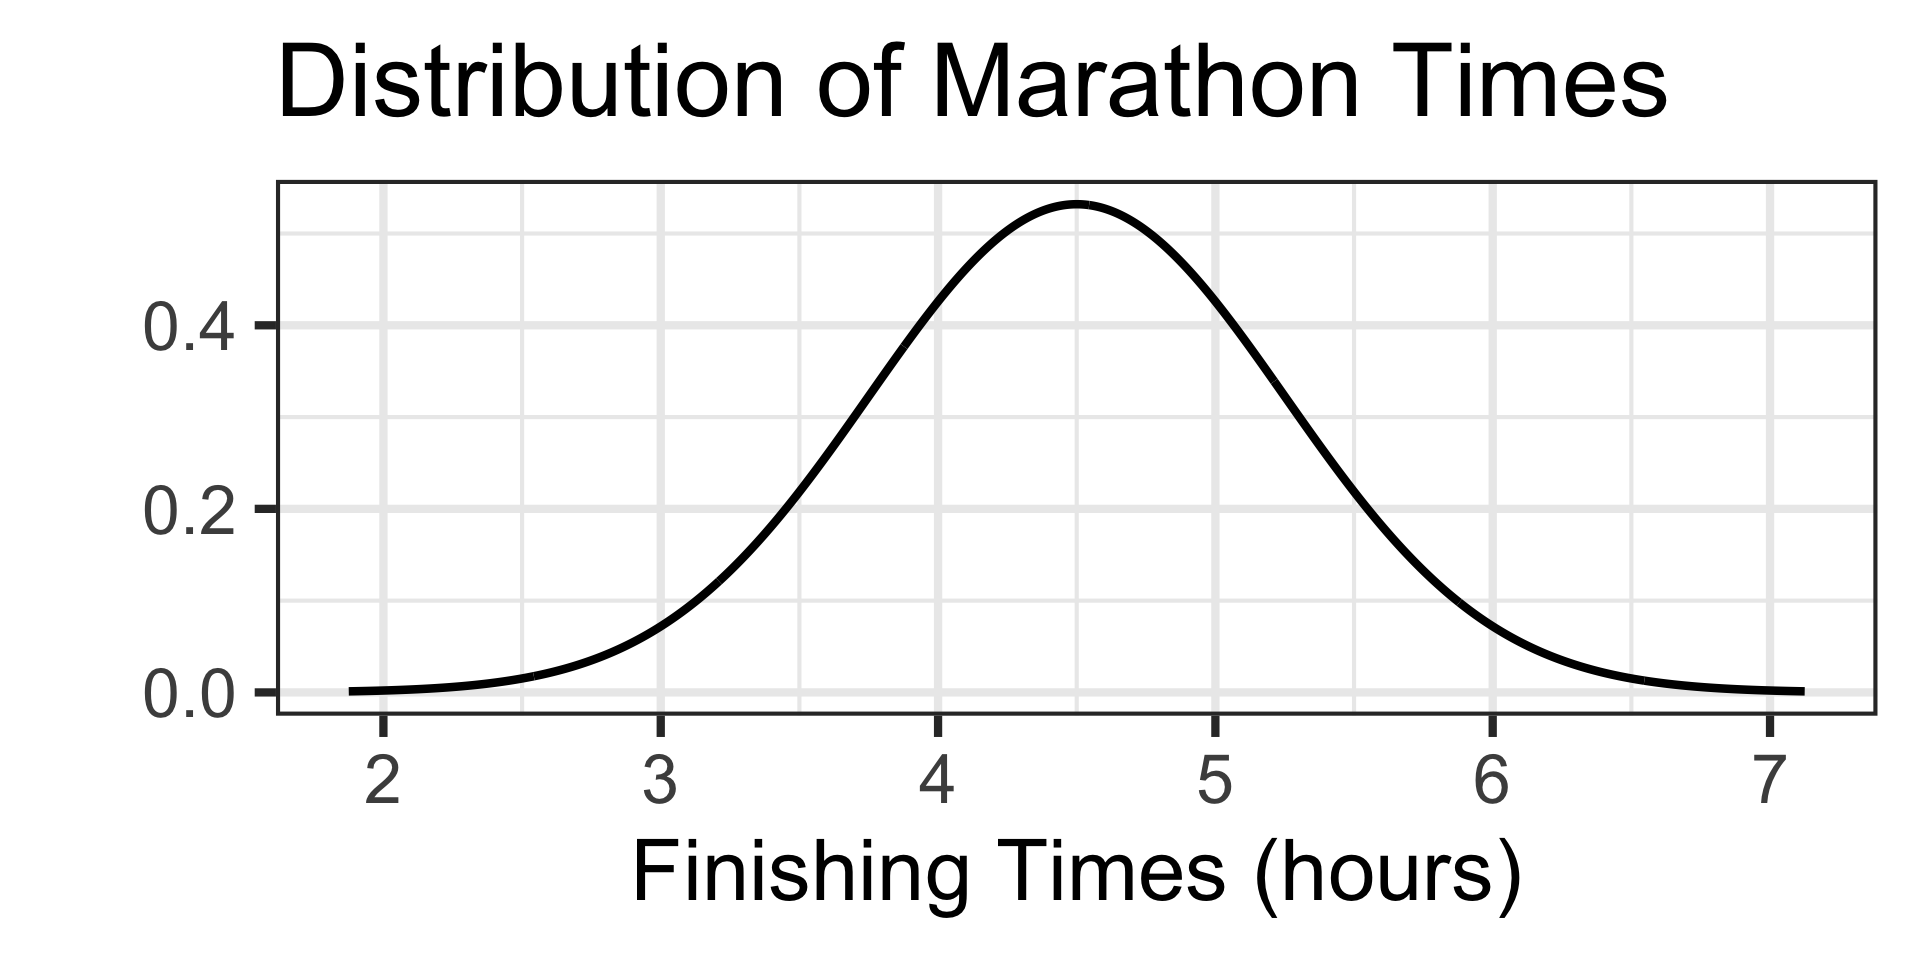
Scenario: The time it takes runners to complete a marathon is approximately normally distributed with a mean of 4.5 hours and a standard deviation of 0.75 hours.
- What is the probability that a randomly selected runner finishes the marathon in less than 4 hours?

Examples: Working with the Normal Distribution
Scenario: The time it takes runners to complete a marathon is approximately normally distributed with a mean of 4.5 hours and a standard deviation of 0.75 hours.
- What is the probability that a randomly selected runner finishes the marathon in less than 4 hours?

How big should our answer be?
Examples: Working with the Normal Distribution
Scenario: The time it takes runners to complete a marathon is approximately normally distributed with a mean of 4.5 hours and a standard deviation of 0.75 hours.
- What is the probability that a randomly selected runner finishes the marathon in less than 4 hours?
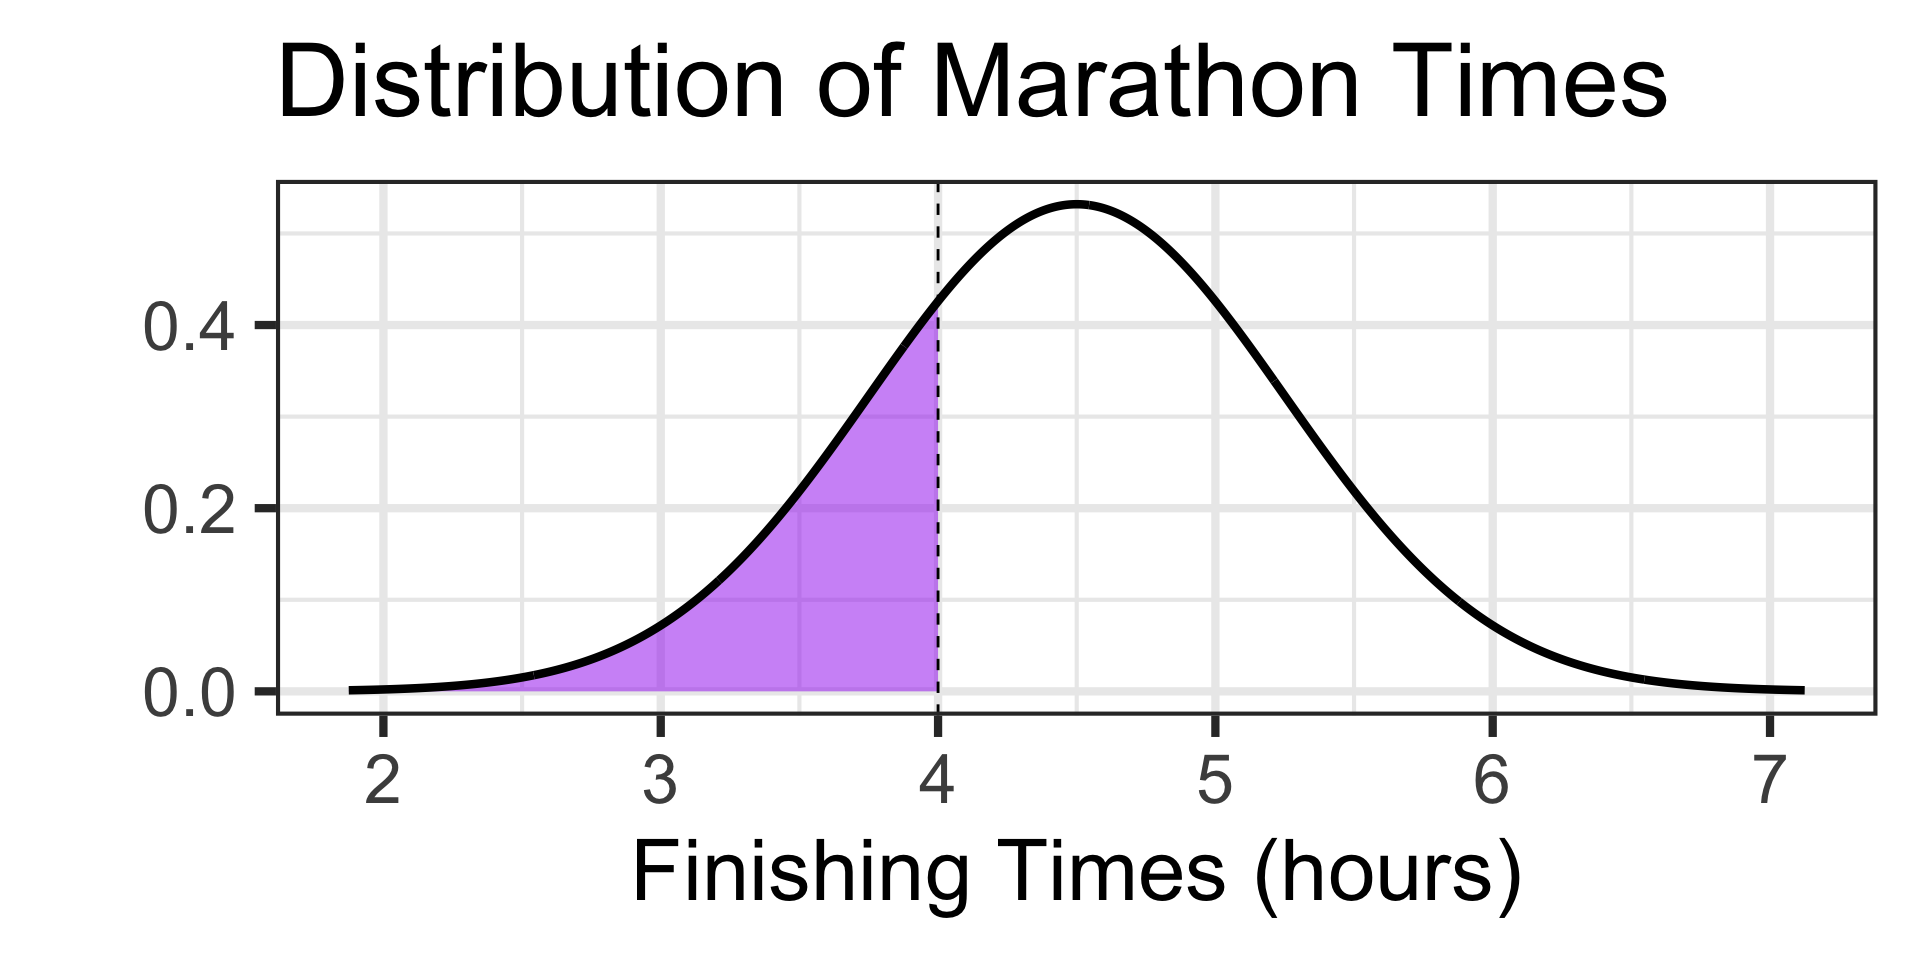
We’re looking for a probability and it should be less than 0.5
Since we have our boundary value and we are looking for a probability, let’s use pnorm()
Answer: There is about a 25.25% chance that a randomly selected marathon runner finished the marathon in under 4 hours.
Examples: Working with the Normal Distribution
Scenario: The time it takes runners to complete a marathon is approximately normally distributed with a mean of 4.5 hours and a standard deviation of 0.75 hours.
- What is the probability that a randomly selected runner finishes the marathon in 3 and a half hours or more?
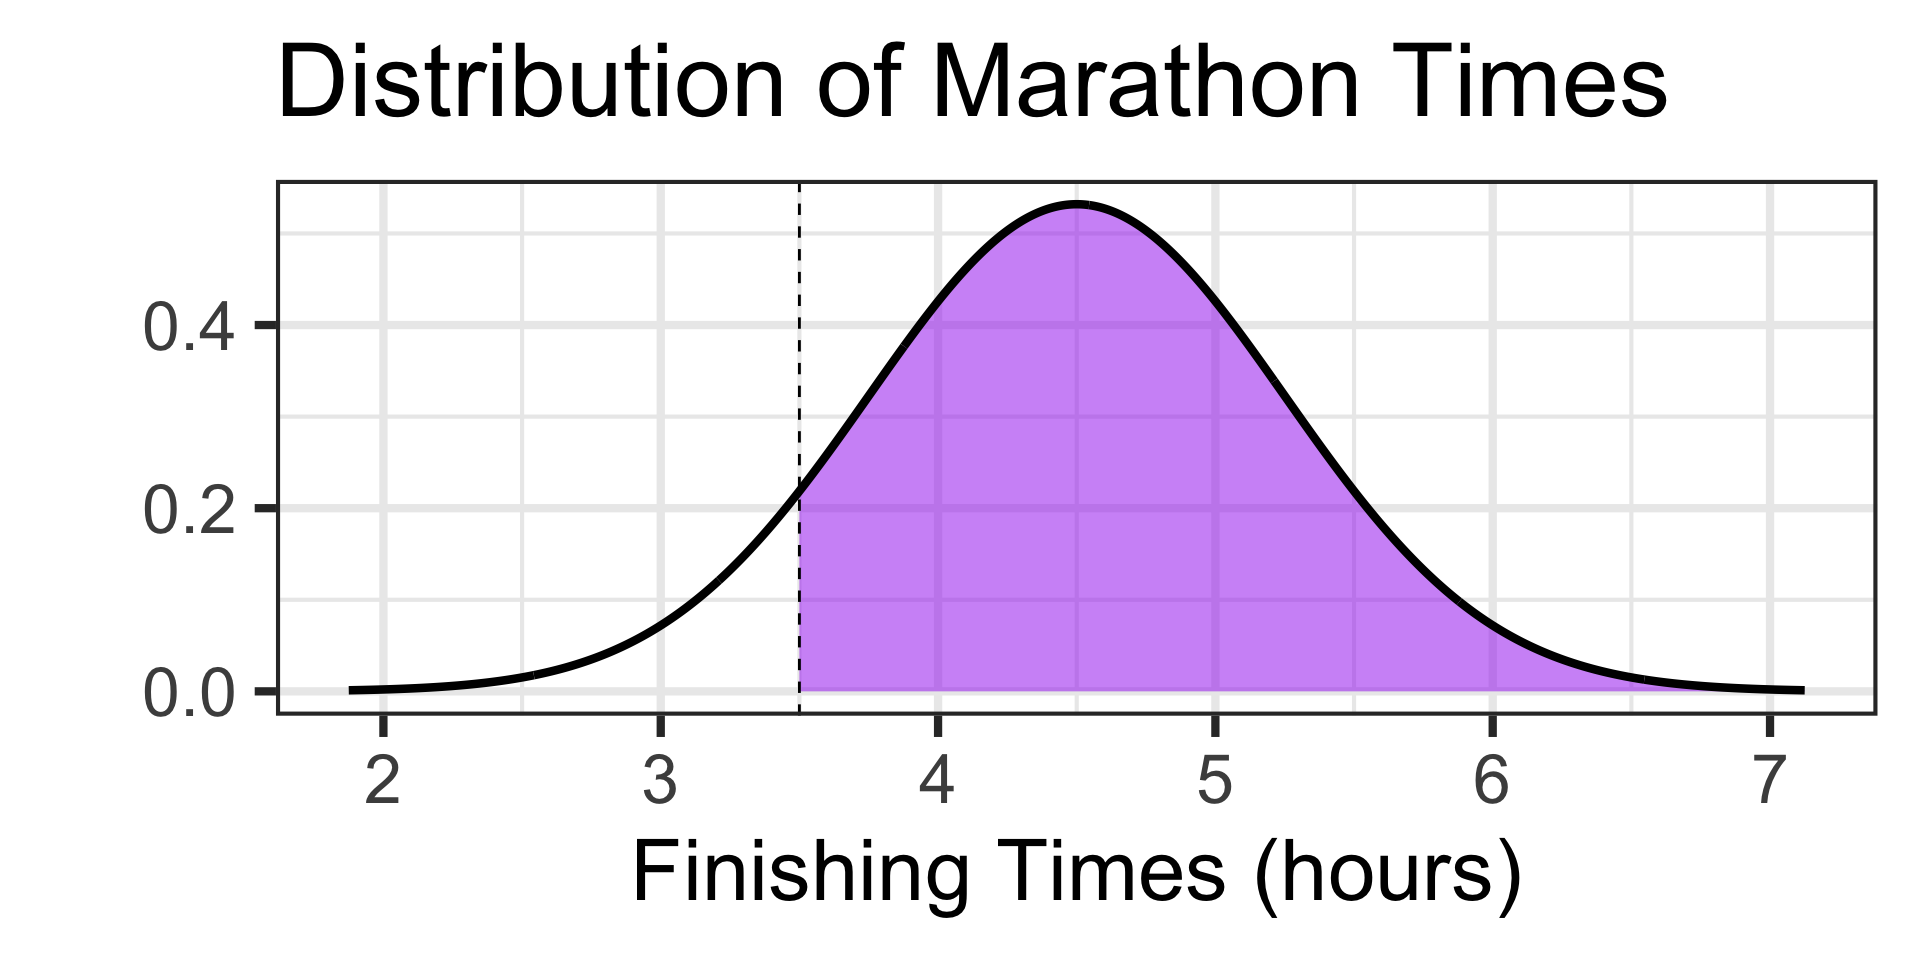
How big should our answer be?
Examples: Working with the Normal Distribution
Scenario: The time it takes runners to complete a marathon is approximately normally distributed with a mean of 4.5 hours and a standard deviation of 0.75 hours.
- What is the probability that a randomly selected runner finishes the marathon in 3 and a half hours or more?

We’re looking for a probability and it should be more than 0.5.
Since we have our boundary value and we are looking for a probability, let’s use pnorm()
Answer: There is about a 90.88% chance that a randomly selected marathon runner finished the marathon in 3 and a half hours or more.
Examples: Working with the Normal Distribution
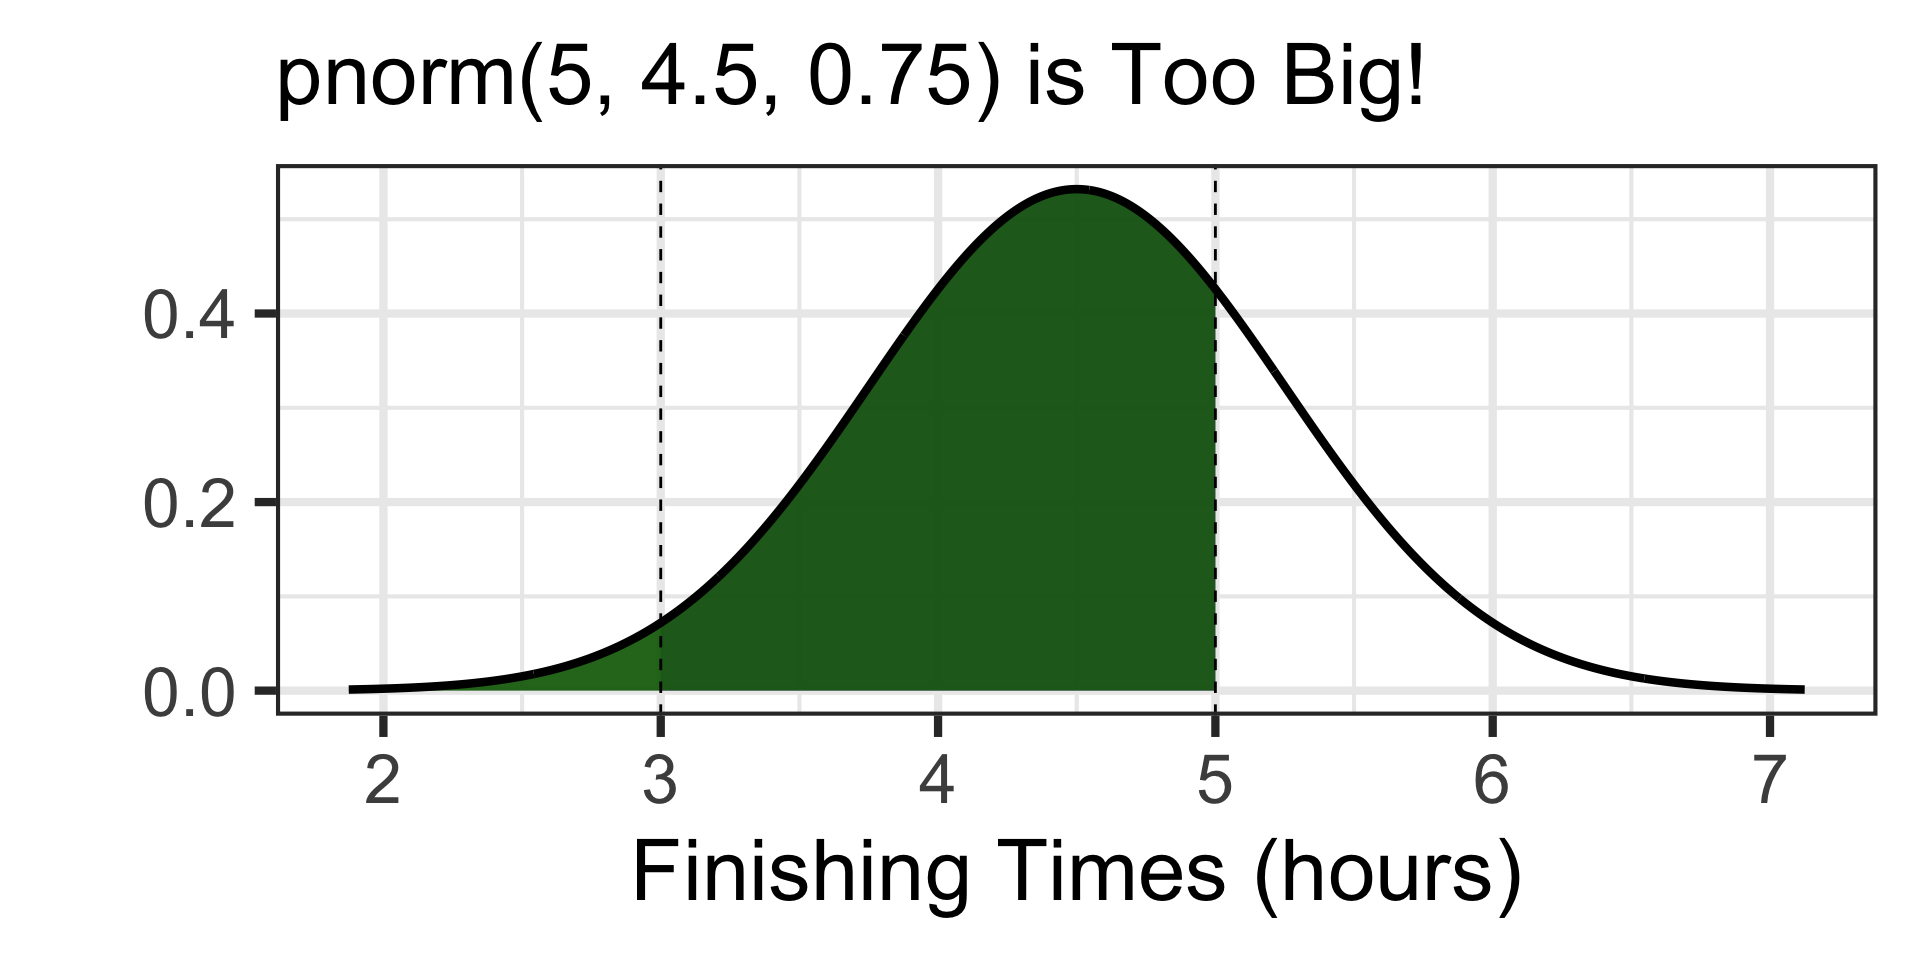
Scenario: The time it takes runners to complete a marathon is approximately normally distributed with a mean of 4.5 hours and a standard deviation of 0.75 hours.
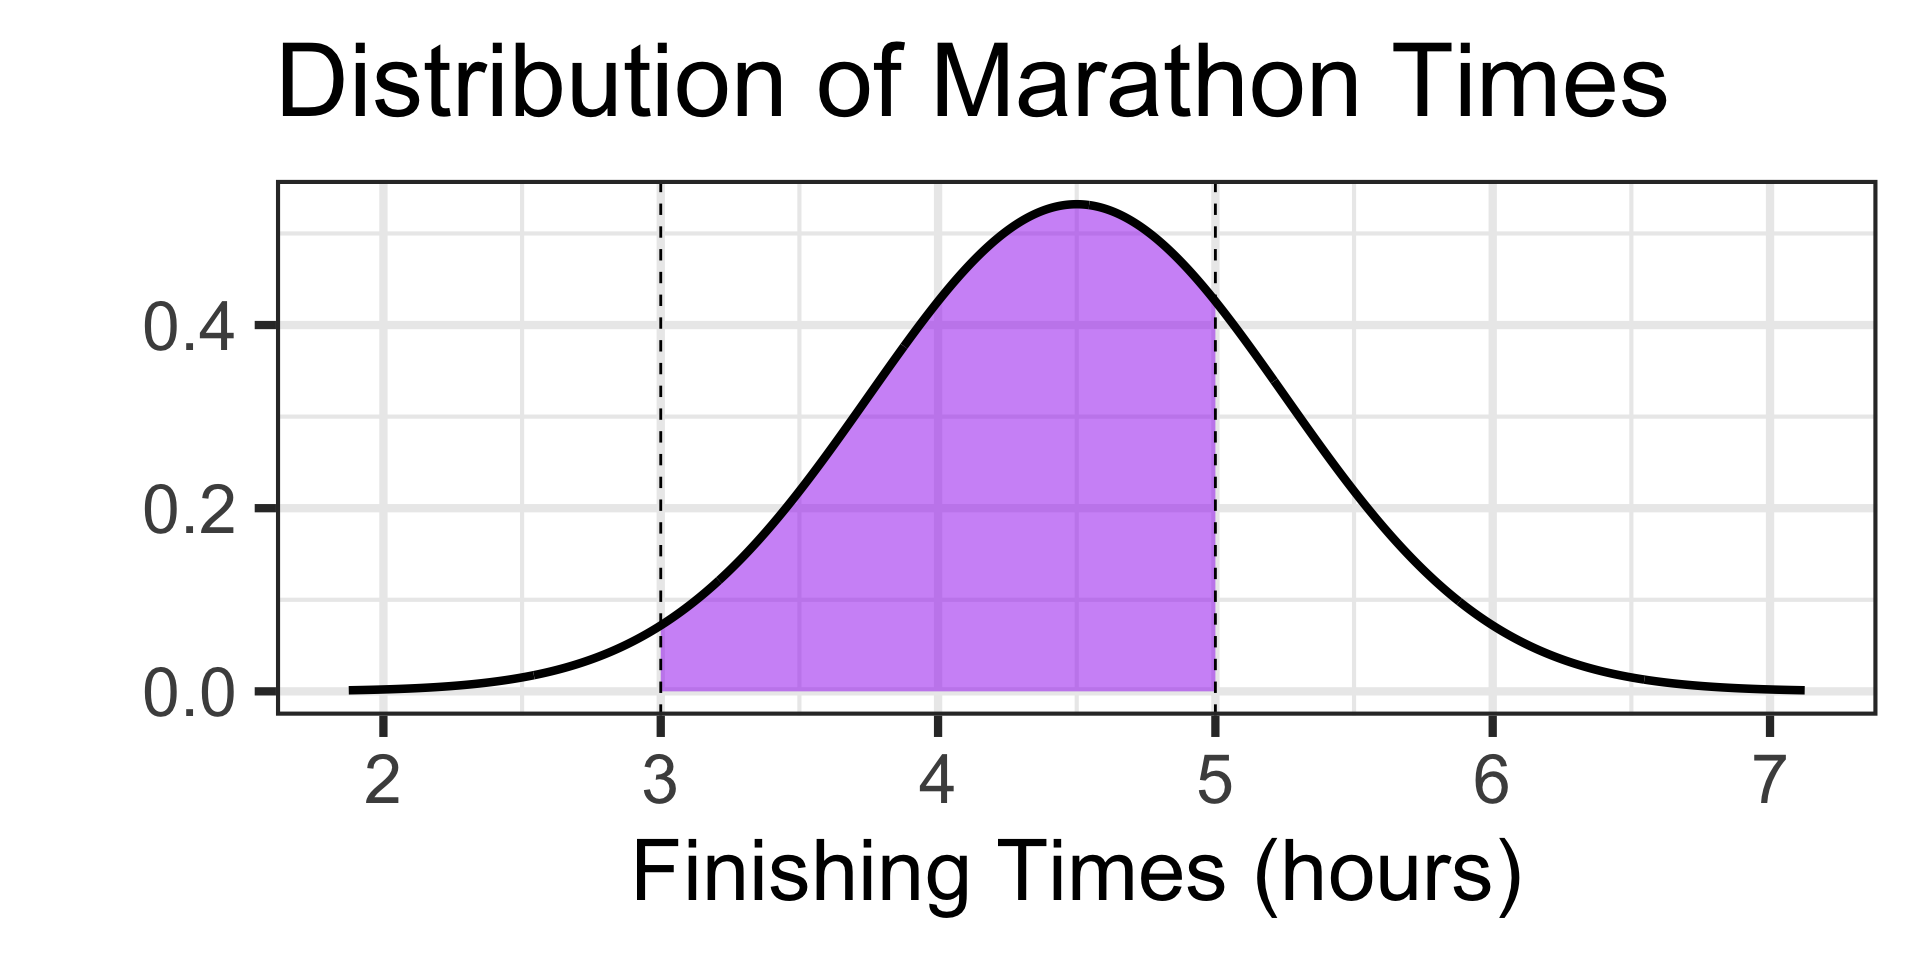
- What is the probability that a randomly selected runner finishes the marathon between 3 hours and 5 hours?

Examples: Working with the Normal Distribution
Scenario: The time it takes runners to complete a marathon is approximately normally distributed with a mean of 4.5 hours and a standard deviation of 0.75 hours.
- What is the probability that a randomly selected runner finishes the marathon between 3 hours and 5 hours?

How big should our answer be?
Examples: Working with the Normal Distribution
Scenario: The time it takes runners to complete a marathon is approximately normally distributed with a mean of 4.5 hours and a standard deviation of 0.75 hours.
- What is the probability that a randomly selected runner finishes the marathon between 3 hours and 5 hours?

How big should our answer be?
It’s tough to tell, but something near 0.5 seems reasonable – nothing too close to 0 or too close to 1 should be expected.
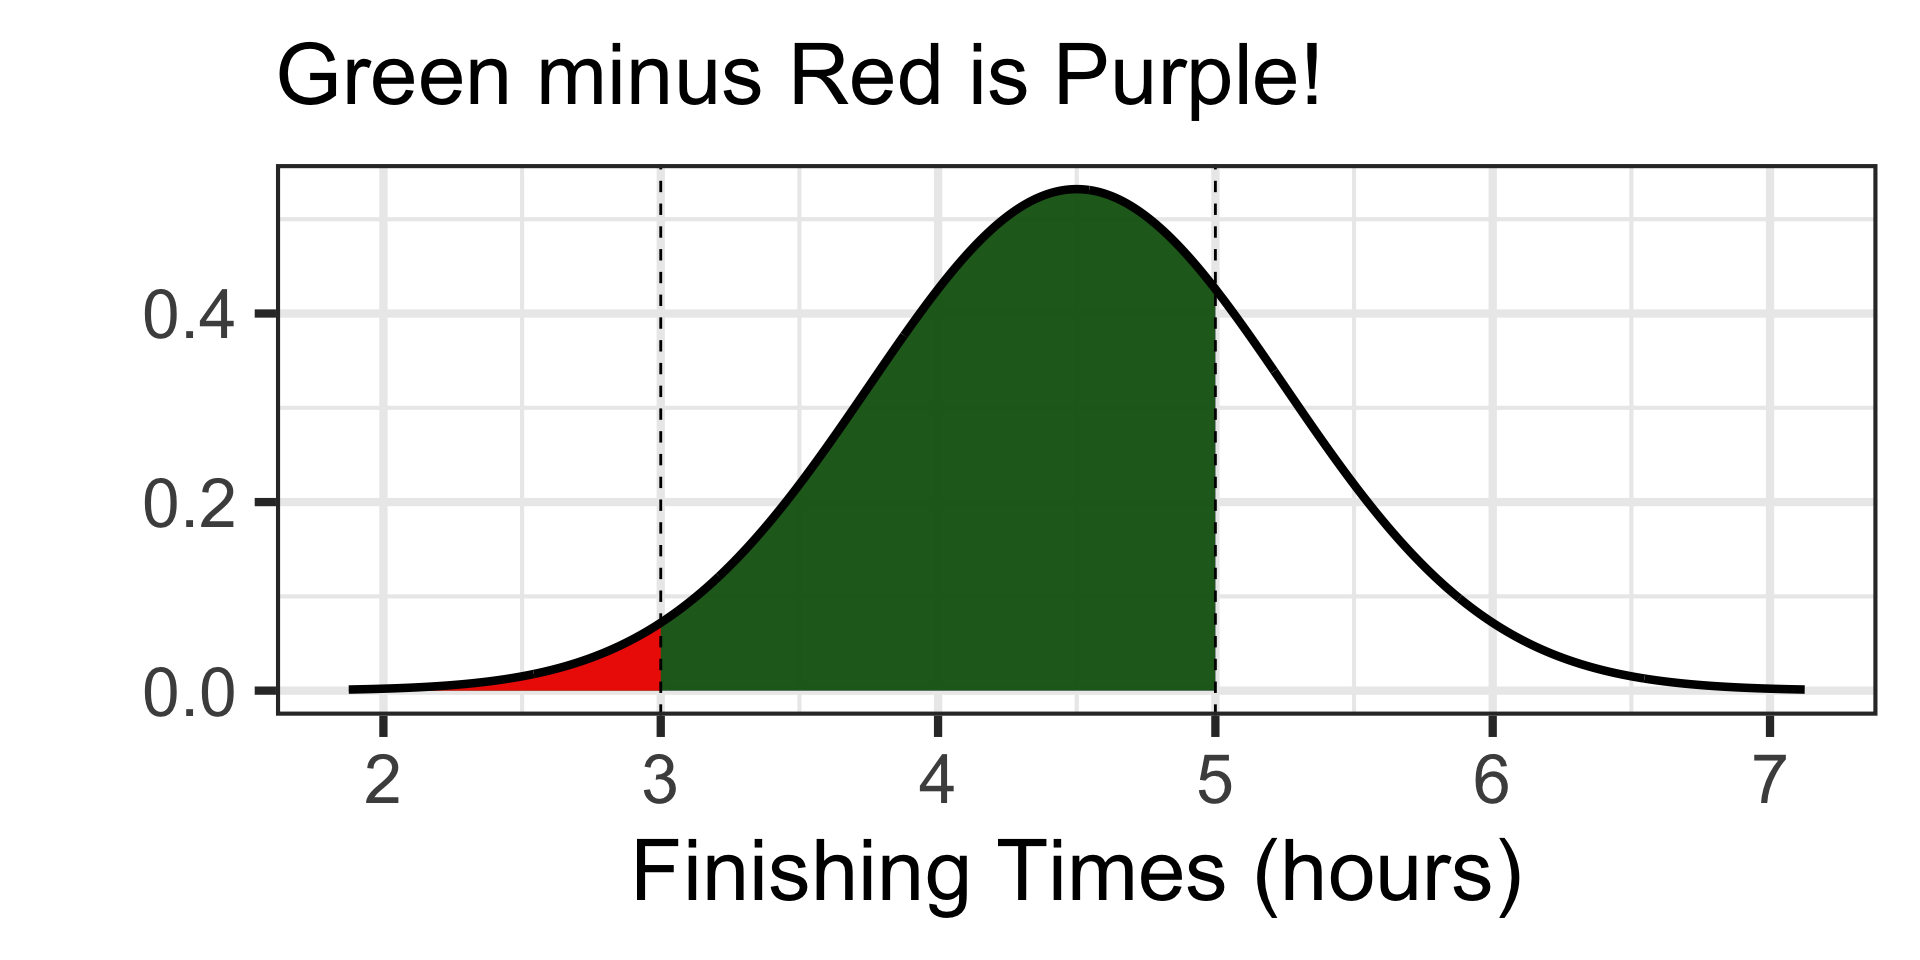
Since we have our boundary values, let’s use pnorm() to find probability.
But How?
Examples: Working with the Normal Distribution
Scenario: The time it takes runners to complete a marathon is approximately normally distributed with a mean of 4.5 hours and a standard deviation of 0.75 hours.
- What is the probability that a randomly selected runner finishes the marathon between 3 hours and 5 hours?

How big should our answer be?
It’s tough to tell, but something near 0.5 seems reasonable – nothing too close to 0 or too close to 1 should be expected.
Since we have our boundary values, let’s use pnorm() to find probability.
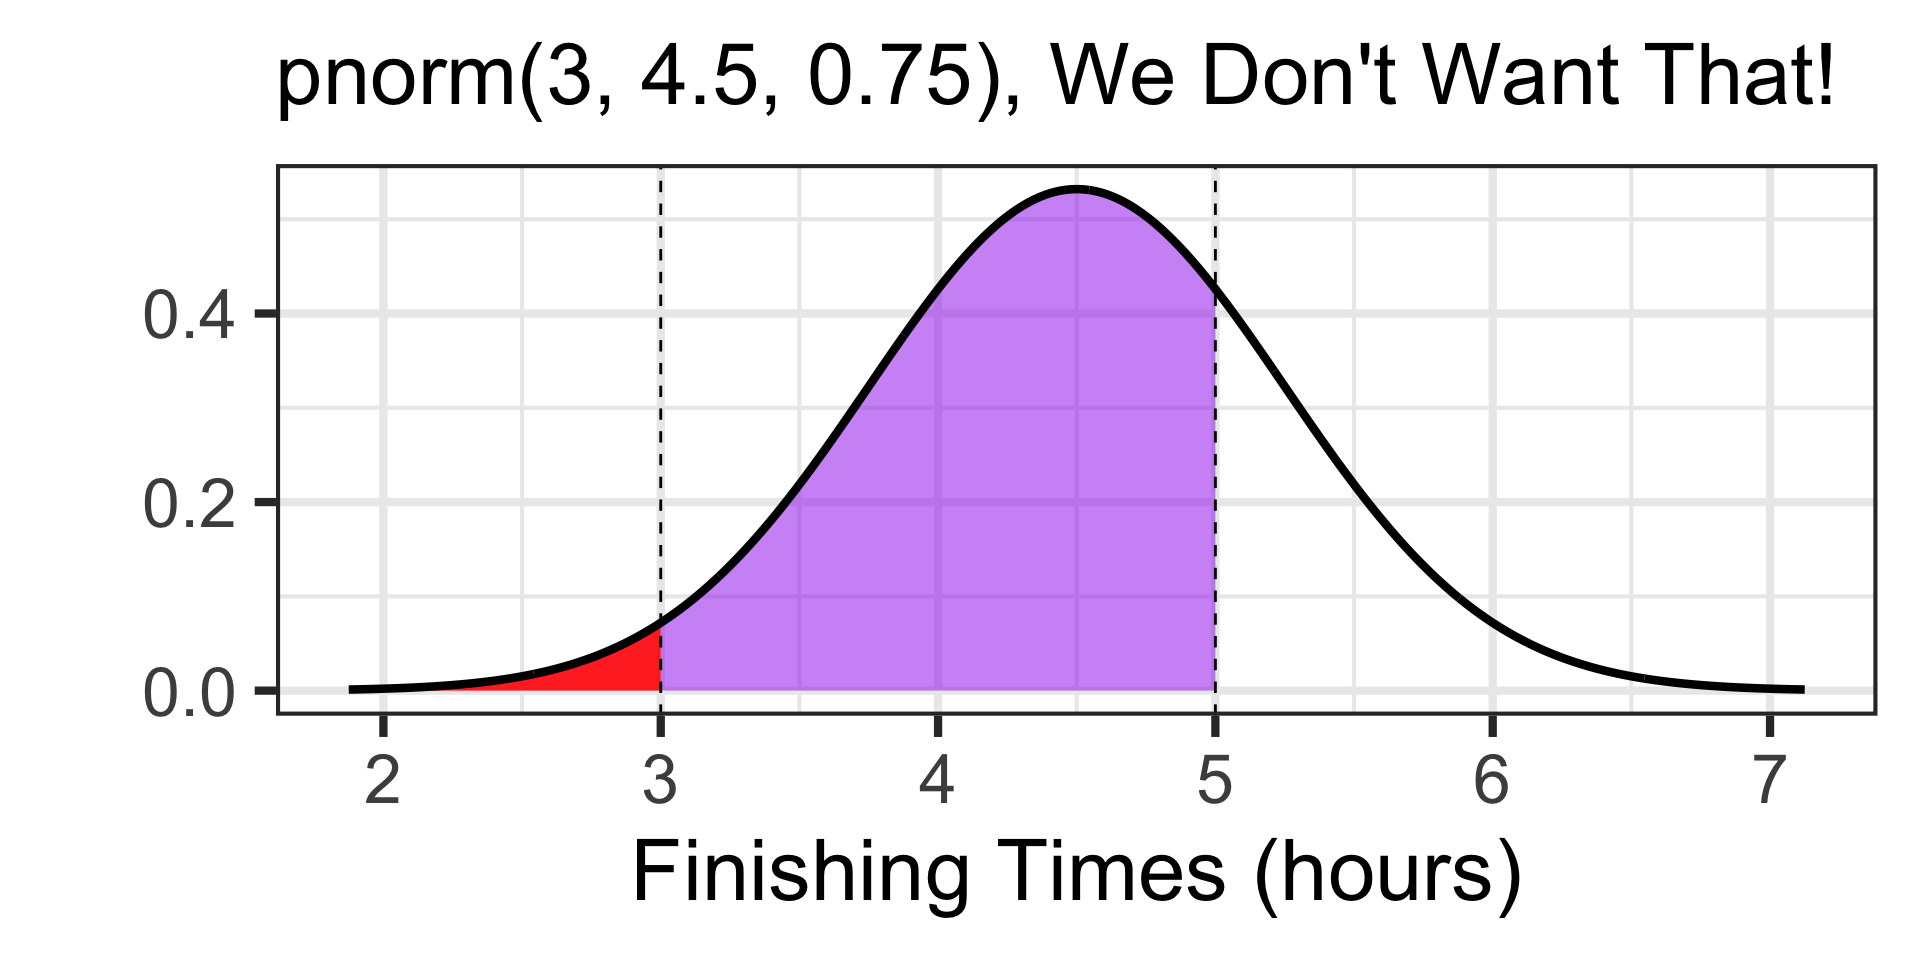

Examples: Working with the Normal Distribution
Scenario: The time it takes runners to complete a marathon is approximately normally distributed with a mean of 4.5 hours and a standard deviation of 0.75 hours.
- What is the probability that a randomly selected runner finishes the marathon between 3 hours and 5 hours?
How big should our answer be?
It’s tough to tell, but something near 0.5 seems reasonable – nothing too close to 0 or too close to 1 should be expected.
Since we have our boundary values, let’s use pnorm() to find probability.
Examples: Working with the Normal Distribution
Scenario: The time it takes runners to complete a marathon is approximately normally distributed with a mean of 4.5 hours and a standard deviation of 0.75 hours.
- At what finishing time do the slowest 20% of runners finish the marathon?

Where are the slowest 20% of runners on this distribution?
Examples: Working with the Normal Distribution
Scenario: The time it takes runners to complete a marathon is approximately normally distributed with a mean of 4.5 hours and a standard deviation of 0.75 hours.
- At what finishing time do the slowest 20% of runners finish the marathon?
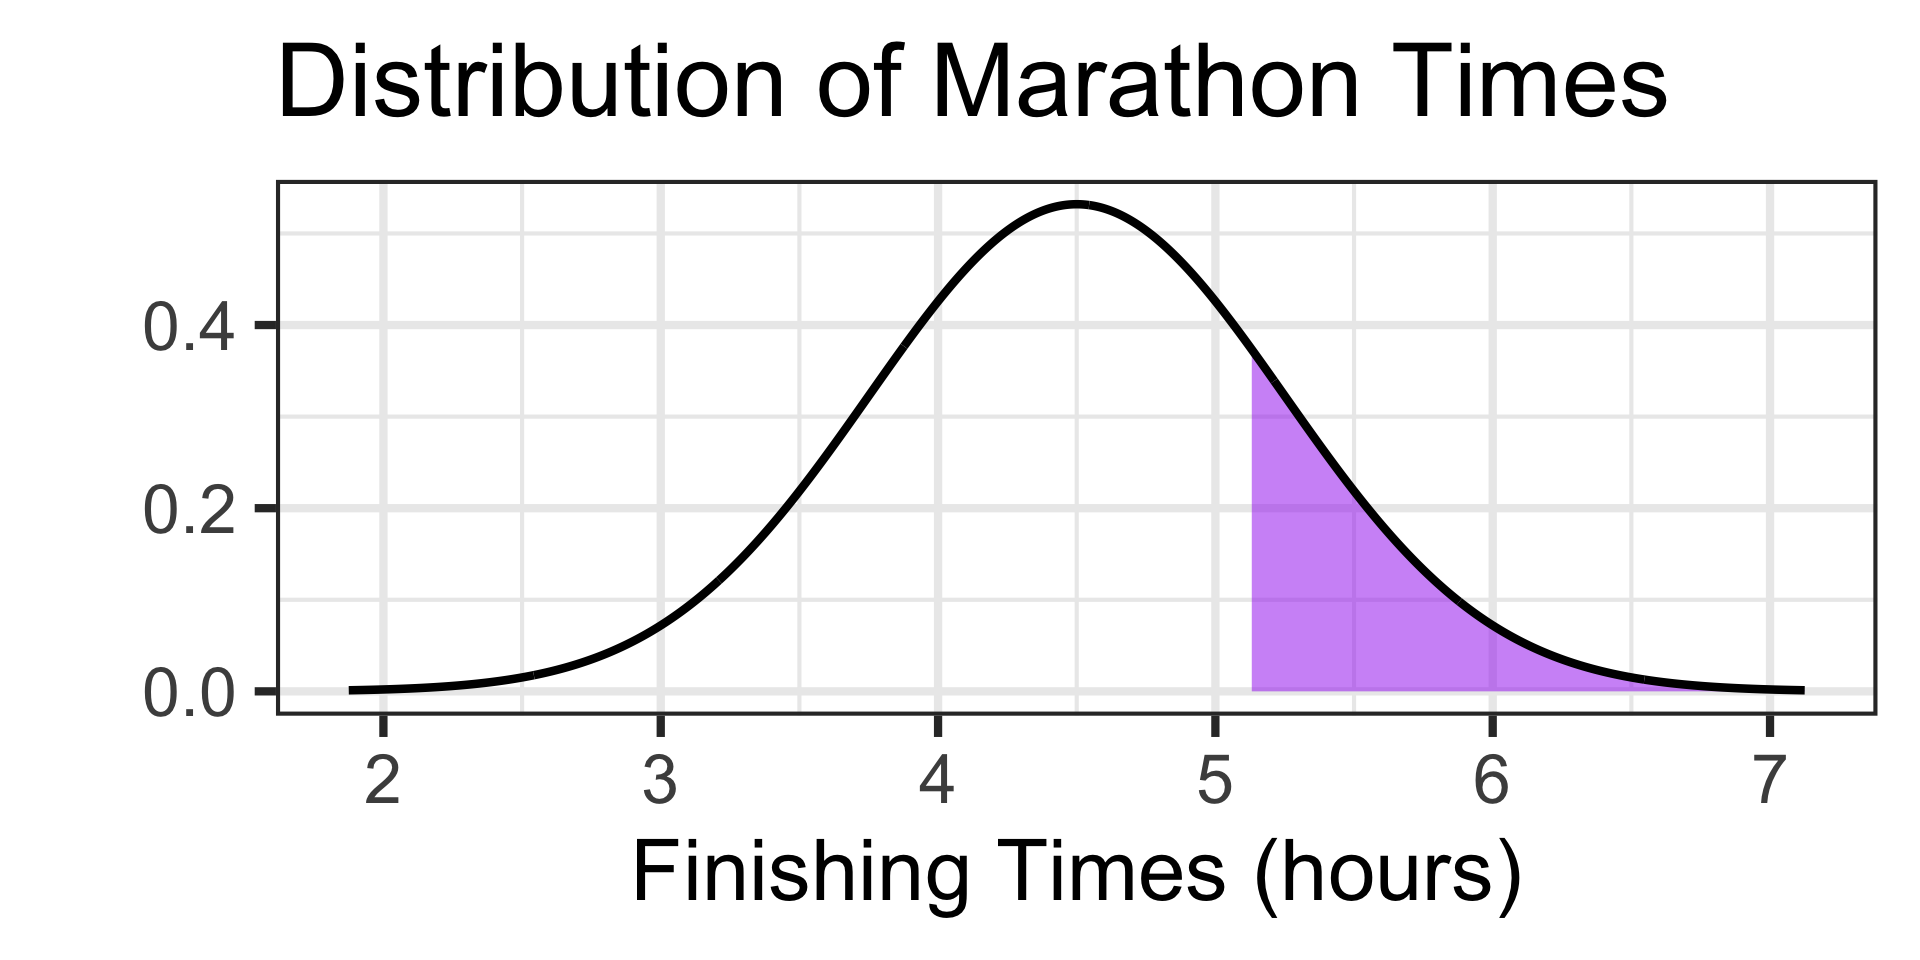
Where are the slowest 20% of runners on this distribution?
There they are! They have the longest finishing times. How long should we expect?
This time, we know the size of that purple area and we are trying to find the boundary value between it and the unshaded portion of the distribution
This will be the minimum finishing time for falling into the slowest 20% of runners
We should use qnorm() in this scenario
Examples: Working with the Normal Distribution
Scenario: The time it takes runners to complete a marathon is approximately normally distributed with a mean of 4.5 hours and a standard deviation of 0.75 hours.
- At what finishing time do the slowest 20% of runners finish the marathon?
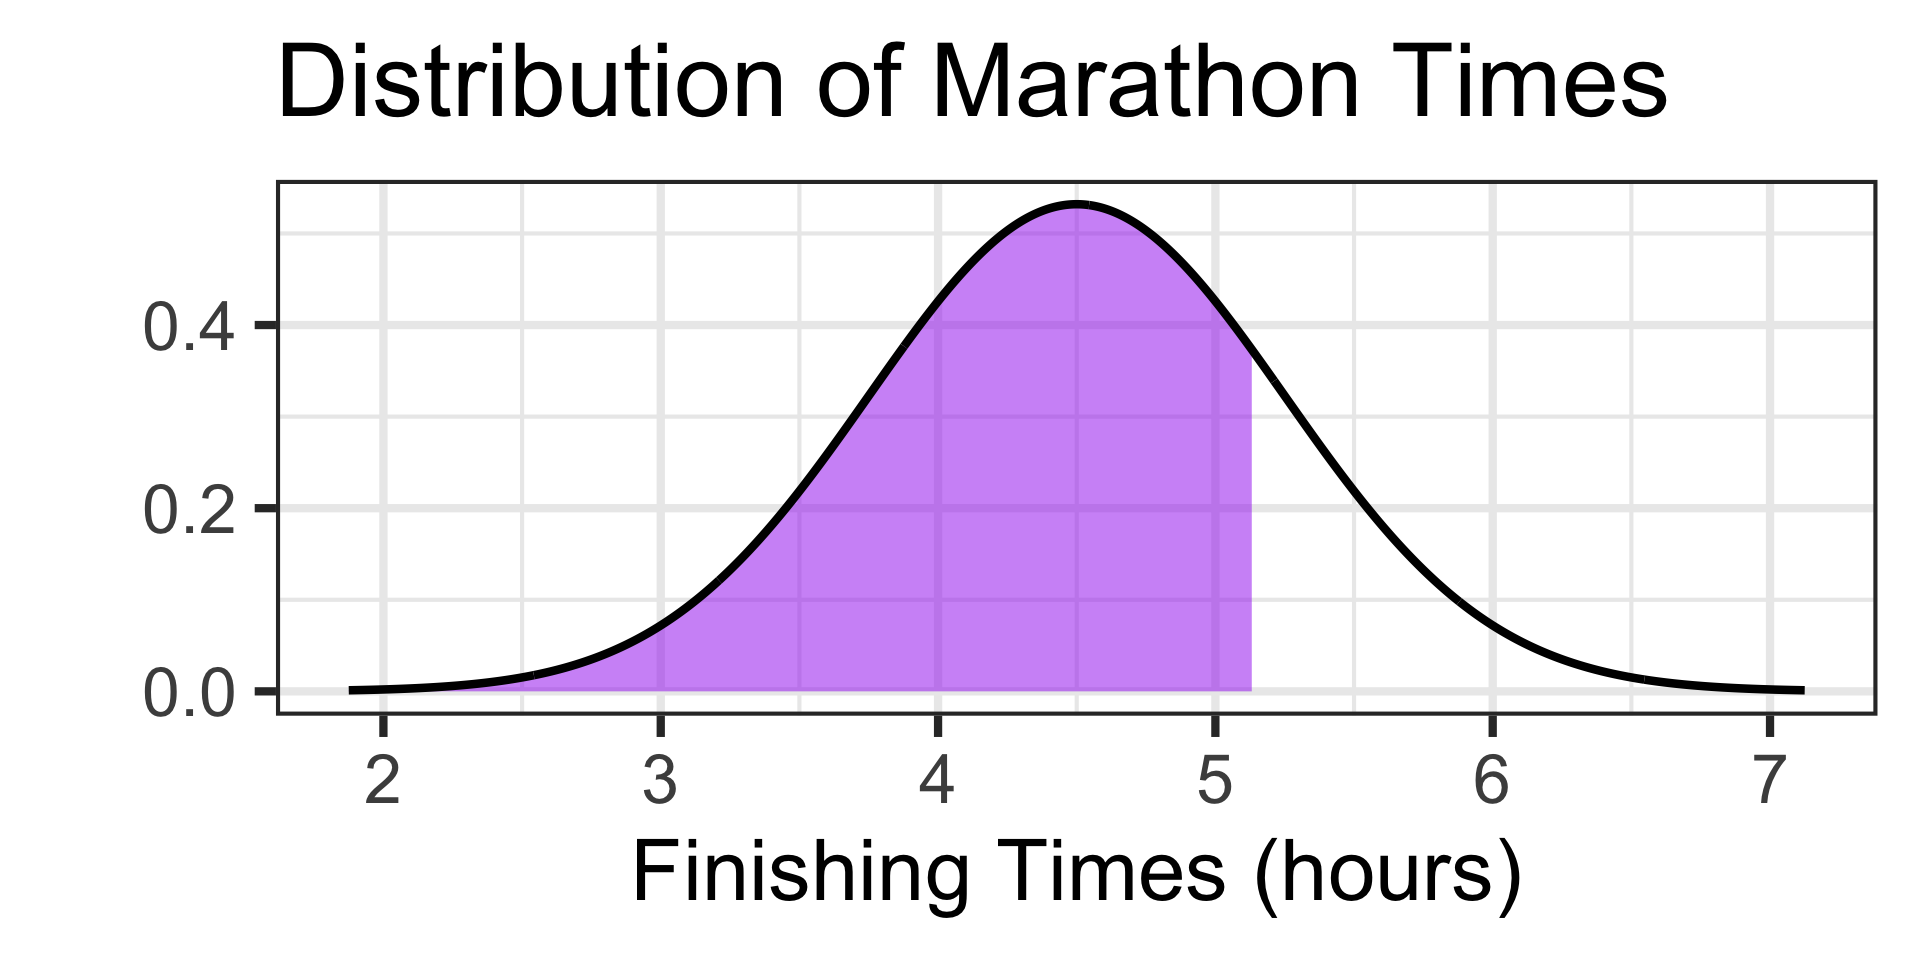
Where are the slowest 20% of runners on this distribution?
There they are! They have the longest finishing times. How long should we expect?
qnorm() requires the area to the left of the boundary value. How big is that area?
Exit Ticket Task
Navigate to our MAT241 Exit Ticket Form, answer the questions, and complete the task below.
Note. Today’s discussion is listed as 6. Normal Distribution

Task: The time in minutes it takes a city bus to complete a particular route during mid-day traffic is approximately normally distributed with a mean of 42 minutes and a standard deviation of 6 minutes. Discuss your approach to each of the following, identify your answers, and mention how you know those answers are reasonable.
- Estimate the probability that a randomly selected bus completes the route in between 43 and 48 minutes.
- Identify the cutoff for the longest 5% of route times.